
July 15, 2026
Paula R. Worthington1
Illinois' pension systems remain one of the State's greatest long-term fiscal challenges. As of June 30, 2024, Illinois' five state-level retirement systems carried approximately $147 billion in unfunded pension liabilities - the gap between the benefits that have been promised to public employees and the assets set aside to pay for them.
These pension obligations have significant implications for the State budget, taxpayers, and Illinois' long-term financial outlook. Understanding how the pension systems have changed over time - and whether current funding practices are improving their financial condition - is essential for policymakers and the public alike.
To help unpack these issues, the Civic Federation has launched a new Illinois State Pensions Dashboard, an interactive tool that allows users to explore more than three decades of historical pension data across the State's retirement systems. Users can compare plans, examine trends over time, and create custom visualizations using a variety of measures of pension funding and financial health.
What's Included in the Dashboard?
The dashboard complements the Civic Federation's Local Government Pensions Dashboard and contains two components. The first includes data for all five State retirement systems:
- Teachers' Retirement System (TRS)
- State Universities Retirement System (SURS)
- State Employees' Retirement System (SERS)
- Judges' Retirement System (JRS)
- General Assembly Retirement System (GARS)
This section allows users to examine historical trends in:
- Unfunded actuarial accrued liabilities
- Funded ratios
- Investment returns
- Employer funding shortfalls
- Average annual benefits
- Membership
The second component focuses on the State's three largest systems—TRS, SURS, and SERS—which together account for nearly all of the State's unfunded pension liabilities. The dashboard provides additional measures for these three funds based on data from the Center for Retirement Research at Boston College's Public Plans Database2:
- Actual versus assumed investment returns
- Employer contributions relative to actuarially determined contributions
- Employer contributions relative to “tread water” funding levels
These additional measures provide insight not just into the size of pension liabilities, but whether current funding practices are sufficient to stabilize or reduce them.
Three Key Insights from the Dashboard
Illinois' Pension Funding Gap Remains Enormous
The dashboard illustrates just how large the State's pension obligations remain. As of FY2024, Illinois' five retirement systems reported a combined $147 billion in unfunded liabilities, with the Teachers' Retirement System alone accounting for approximately $84 billion.
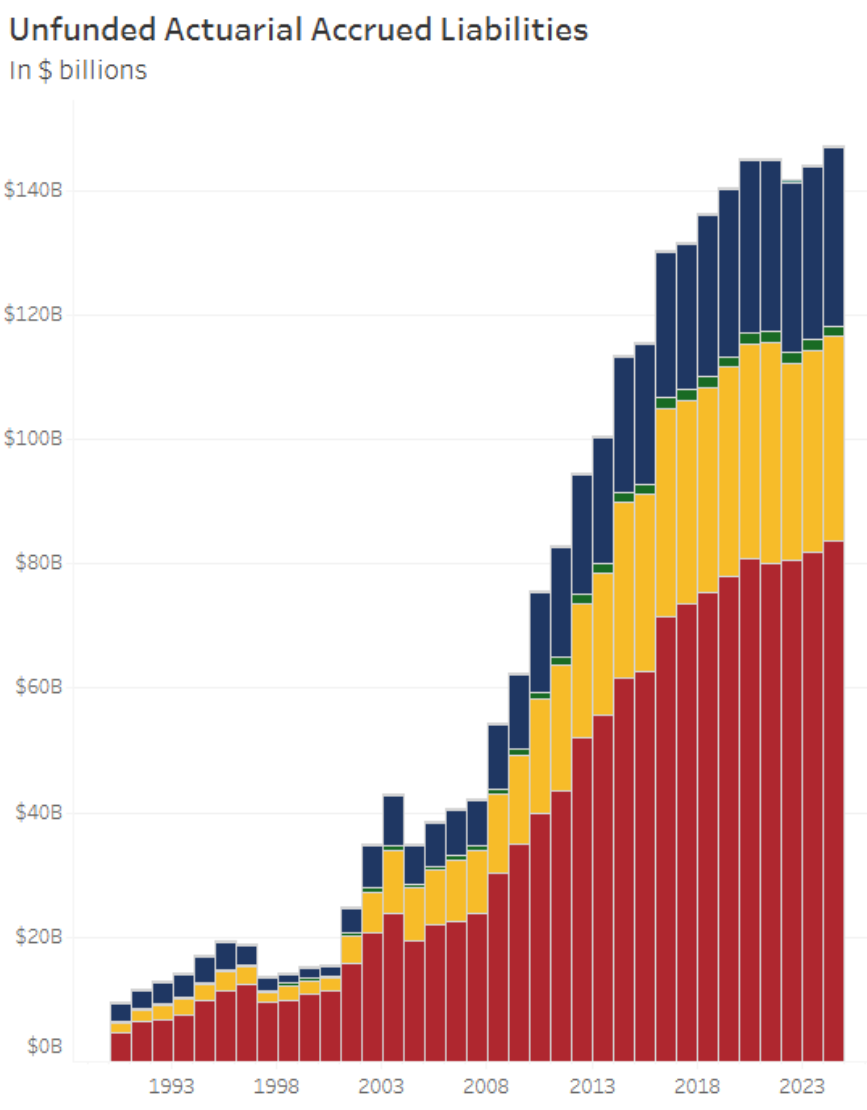
While funded ratios have improved modestly in recent years, Illinois continues to have one of the largest pension funding gaps of any state in the nation. The dashboard allows users to see how these liabilities have evolved over time across each of Illinois’s retirement systems.
Meeting Statutory Funding Requirements Does Not Mean Adequately Funding the Systems
One of the most useful features of the dashboard is its ability to compare the State's actual pension contributions with several funding benchmarks. Illinois generally makes the contributions required under State law.3 However, statutorily required contributions are designed to reach only 90% funding by 2045 using a funding methodology that has long been criticized by actuaries for delaying repayment of unfunded liabilities. As a result, meeting statutory requirements does not necessarily mean funding the pension systems on a sound actuarial basis.4
Using the dashboard, users can compare actual contributions with two other benchmarks:
- Actuarially Determined Contributions (ADCs): the contributions needed to fund pension benefits on a sound actuarial basis.5
- "Tread water" contributions: the minimum contributions needed to prevent unfunded liabilities from increasing, assuming all actuarial assumptions are met.
These comparisons help users evaluate whether current contributions are sufficient to improve the financial condition of the pension systems - not simply satisfy statutory requirements.6
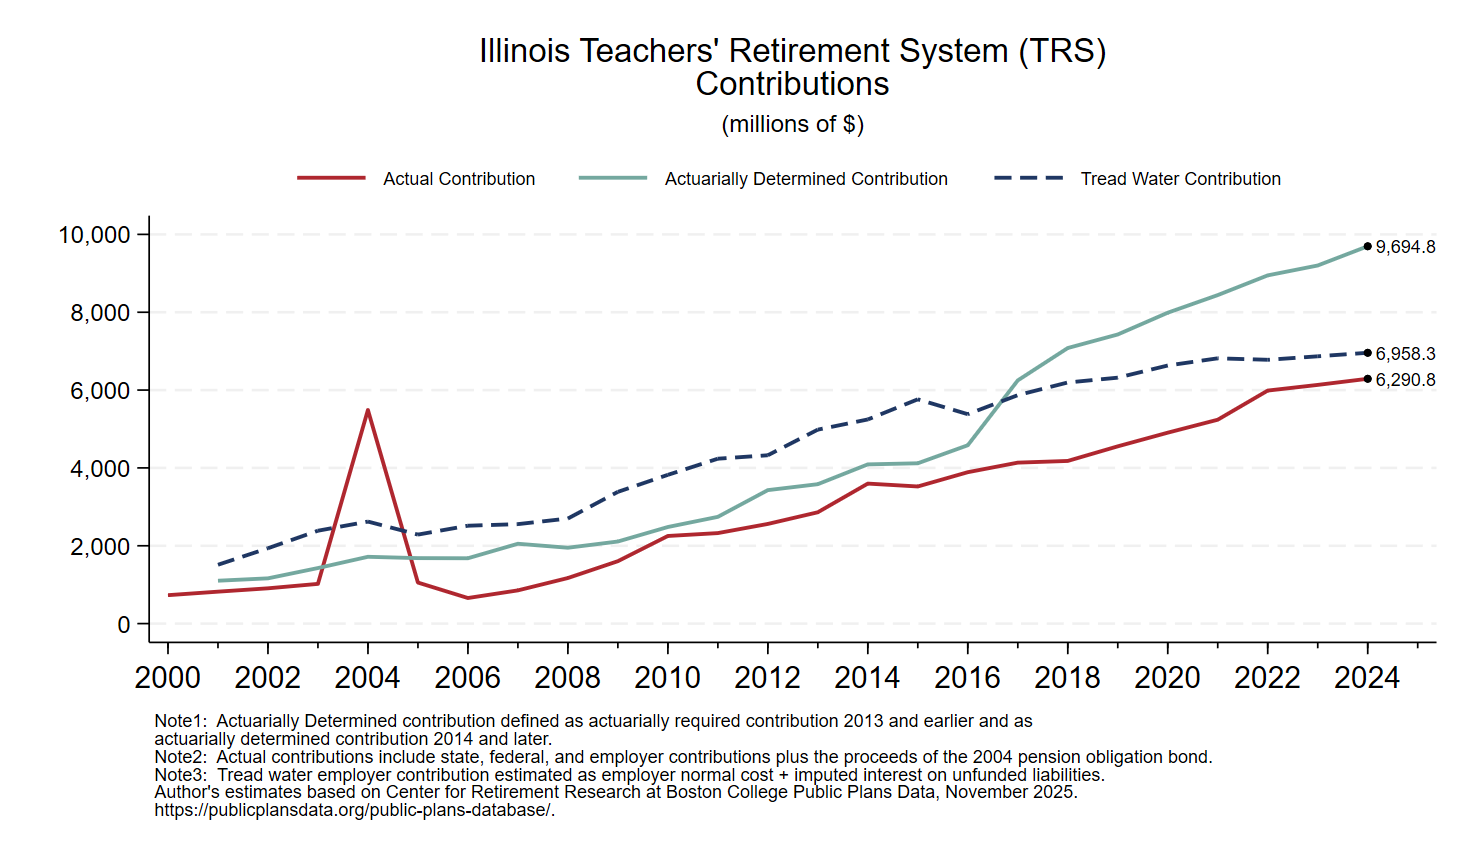
For example, consider the TRS system. Actual contributions to TRS have increased substantially over time, reaching $6.3 billion in 2024. These increased contributions have placed growing pressure on the State budget, yet still fell short of the nearly $7.0 billion “tread water” level in 2024. Progress in closing the gap between actual and tread water contributions has begun slowing the growth of unfunded liabilities: between 2008 and 2016, TRS unfunded liabilities grew at an average annual rate of approximately 11.4%. Between 2016 and 2024, that growth slowed to roughly 2.0% annually.
Legacy Unfunded Liabilities Make “Treading Water” Expensive
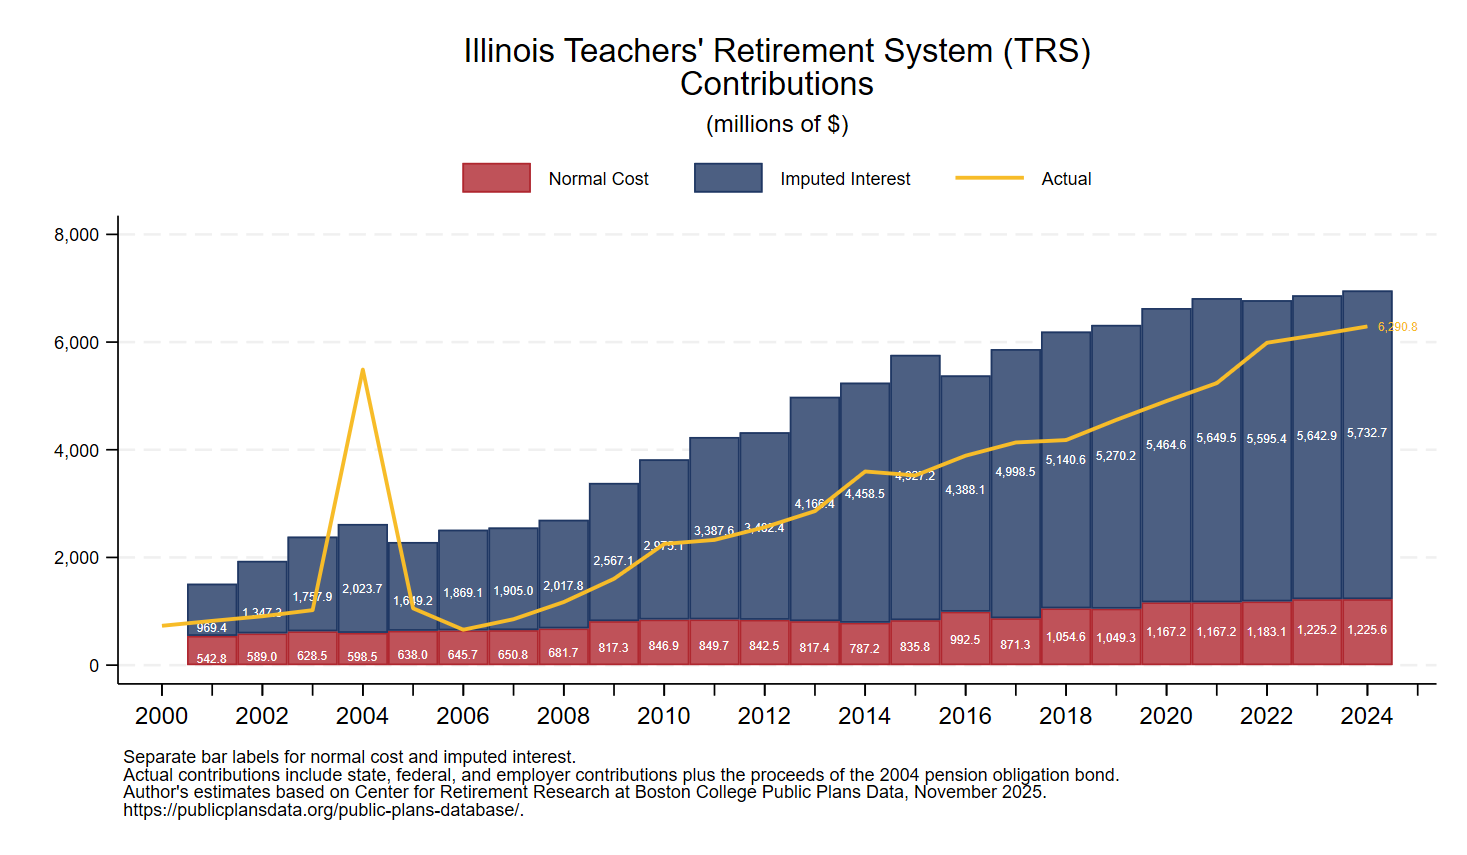
The dashboard also helps explain why reaching the "tread water" contributions threshold has become increasingly difficult. As unfunded liabilities have grown, so, too, has the annual interest cost associated with those liabilities. Today, much of the employer contribution goes toward covering interest on existing pension debt rather than paying it down. Again, consider the TRS system. Employer normal cost is relatively small and not growing rapidly, but imputed interest payments on the unfunded liabilities have increased significantly, driving this contributions threshold higher and higher.
Explore the Dashboard
The Illinois State Pensions Dashboard is designed to help policymakers, researchers, journalists, and members of the public better understand one of the State's most significant fiscal challenges. By bringing together historical data and interactive visualizations, the dashboard allows users to move beyond headline measures such as funded ratios and examine the factors driving pension funding over time.
We encourage users to explore the dashboard, review the accompanying glossary and methodology, and share feedback as we continue improving this resource in future updates.
References
1The author thanks Lily Padula, Brian Septon, Sarah Wetmore, Roland Calia, and Annie McGowan for their thoughtful comments on earlier drafts.
2Data on JRS and GARS are not available from that source.
3 More details on the State’s use of pension obligation bonds, partial pension funding “holidays”, and supplemental payments add nuance to this claim, but the basic point remains: the State has met its statutory obligations over time.
4A sound actuarial funding policy is one that, if followed, would cover normal costs and achieve “positive amortization,” in which unfunded liabilities are paid off in a reasonable amount of time (less than 30 years). See discussion here.
5 Pension fund reporting requirements and contributions concepts have changed over time, as discussed here.
6 A nice discussion of “contribution sufficiency” measures is here.