
April 07, 2017
Is Illinois a high tax state, a low tax state or somewhere in the middle? With various revenue proposals competing to address the State’s ongoing fiscal crisis, it is important to consider where Illinois stands now in relation to other states. Does Illinois have room to raise taxes, or would such a move make it an outlier among competing states and therefore impair competitiveness? This blog will explore the methodology behind several of the better known rankings of tax burdens among the states.
At its most simple and abstract, comparing tax burden is basic division:

However, there is significant debate about what should or should not be included in both the numerator and the denominator of this equation.
In addition to the size of the tax burden, there are numerous complicating factors to consider, such as the composition of types of revenues, such as income tax, sales tax, property tax, fees and fines, etc. The composition in turn has important implications for revenue volatility. Another factor is the overall progressiveness of the tax structure—whether relatively more of the burden is placed on high or low income residents. A third factor is the amount of unfunded liabilities (such as for pensions) that may or may not be reflected in the current tax burden. This blog post will focus on the more basic question of size. How large is the tax burden that Illinoisans currently have to bear compared with other states?
Comparisons of state tax burden tend to come from one of two methodological “families.” The simplest method is to take revenues as measured by the Census Bureau and divide by personal income, as measured by the Bureau of Economic Analysis. This approach focuses on the total revenue raised by governments in a state, including from residents of other states. Versions of the Census data method are used by the Federation of Tax Administrators, the Tax Policy Center and the Center for Budget and Policy Priorities, among others.
The other widely-cited method, developed by the Tax Foundation, approaches the question from a different perspective. It attempts to calculate the total taxes paid by residents of a state, including to governments in other states.
The differences are more than esoteric disagreements on methodology. For example, the Census data method ranks Alaska first in revenue as a percent of personal income nearly every year. The Tax Foundation consistently ranks the state 51st in tax burden. How can such a dramatic difference be possible? Is there any way that both rankings accurately describe what’s going on in Alaska?
A somewhat less extreme but still stark difference is Illinois, which in Fiscal Year 2012, the last year for which the Tax Foundation has done calculations, was ranked fourth by that organization, but only 24th according to the Census data method. Since FY2012, the temporary income tax increases have expired, likely causing both ranks to drop. For Illinois legislators contemplating sharp tax increases to address a proposed FY2018 budget gap of at least $4.6 billion and a bill backlog of nearly $13 billion, it would be useful to know where the increases will place the State relative to other states. A deeper examination of the two methods reveals important choices about the way we measure government revenue and what it means for the residents of a state.
The two methods share some key assumptions. The first is that both state and local taxes should be included in the calculation. The reason is that different states have very different ways of allocating responsibilities between state and local governments. A fair comparison must take into account both levels. The second commonality is that the level of taxation should be divided by total state personal income, or some other measure of ability to pay such as gross state product. This is more reasonable than an assessment of tax burden per capita because a wealthier state can, in general, afford higher taxes and more services than a poorer one, regardless of the number of residents it has. Illinois is a relatively wealthy state, ranking 14th in per capita personal income.
The first major difference between the two methods of calculating tax burden is in the composition of revenues. Most rankings that use the Census data method include all of a state’s “own-source” revenues. Own-source means all revenues generated by state and local governments, excluding federal transfers. Total own-source revenue includes both taxes and various fees and charges that state and local governments receive in exchange for services provided. The Tax Foundation excludes most of the latter, focusing only on taxes. One argument for excluding non-tax revenues is that states with stronger non-profit institutions, such as hospitals and universities, might rely less on fees for publicly-provided services. On the other hand, government fees are a burden borne by residents that might substitute for taxes. For instance, drivers on both toll-roads and open-access highways have paid for the road in one form or another.
However, even if non-tax revenues are excluded from the Census data method, there are still significant differences between the two rankings. In 2012 Illinois ranked ninth in total taxes as a percent of personal income and fourth by the Tax Foundation. Alaska still ranked first and 51st, respectively. These discrepancies are explained by the other major difference between these methods: an assessment of tax incidence. The Tax Foundation applies a series of calculations to both tax revenue and personal income to exclude taxes collected in a state that are paid by residents of other states and to include taxes paid by a state residents to other states. For instance, taxes that fall heavily on tourists and commuters are allocated partially to other states. Taxes on oil production are assumed to be shared nationwide by consumers (which explains a large part of the discrepancy on Alaska).
There are pros and cons to this approach too. On one hand, it is true that taxes paid to other states are a very real burden on taxpayers, whereas taxes that come in from other states allow government services to be provided without adding to residents’ tax burden. On the other hand, when legislators consider tax policy, they have little control over the decisions made by other states. Budgets are balanced with the revenues collected, regardless of the source.
The following table compares Illinois’ rankings by the different methodologies for the period of FY2007 through FY2012, the last year the Tax Foundation rankings are available. Census data is available through FY2014, the last full year before Illinois’ income tax increases were partially rolled back to 3.75% for individuals and 5.25% for corporations.
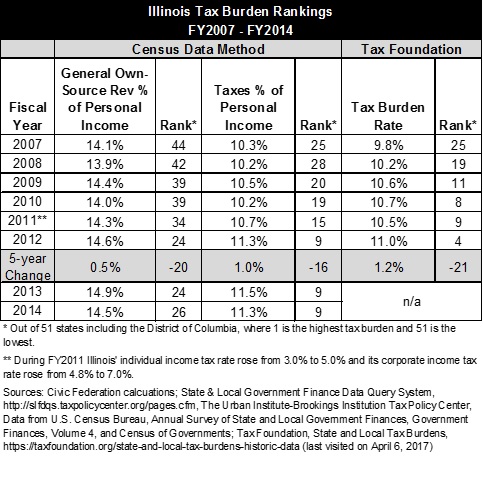
Taken together, there are two important implications of the differences in these rankings. The first is that since the own-source Census data ranking is a higher number than the taxes-only Census data ranking, Illinois collects relatively little in non-tax revenues as a percent of total own-source revenues, compared to other states. It ranked 48th in FY2014. The second is that since the taxes-only Census data ranking is a higher number than the Tax Foundation ranking, Illinois exports a relatively middling amount of its tax burden to residents of other states. It was 26th in the difference between these two rankings in FY2012.
Perhaps the most important takeaway from this comparison is the need for clarity. When policymakers and commentators cite these rankings as justification for tax policy changes, it is important that they specify which ranking method they are using and acknowledge that the most recent rankings available are from a year when Illinois taxes were substantially higher than they are now.