October 31, 2025
by Daniel Vesecky
In 2019, the City of Chicago (Chicago or the ‘City’) had a budget of $8.9 billion, excluding grants from the State of Illinois (Illinois or the ‘State’) and the Federal government. By 2025, expenditures had grown to $12.4 billion—a 40% increase. Using 2019 as a baseline, this report explains how much the Chicago budget has grown compared to pre-pandemic levels of spending and what areas of the budget are driving that growth.
The City of Chicago’s budget is broken into a system of funds. The primary types of funds are:
- The Corporate Fund: The City’s “general operating fund” is supported by a range of taxes and non-tax (fees, fines, forfeitures) revenue sources over which the City has the greatest latitude on use. The Corporate Fund is typically the focus of the annual budget season.
- Enterprise Funds: These are funds such as aviation and water that draw most of their revenue from fees charged for the corresponding service. Enterprise funds act almost as self-contained operations, providing a city service using the payments residents make for that service. For example, water rates contribute to the Water Revenue Fund, which is used to pay for the City’s water system.
- Special Purpose Funds: The City has numerous special purpose funds that account for specific activities and are funded through dedicated tax and fee sources.
- Grants: Most grants are federal and primarily fund infrastructure and social service programs such as housing, public health, and family support.
This report focuses on the City’s core budget functions through all local funds, including the Corporate Fund, Enterprise Funds, and Special Purpose Funds. It excludes grants because most are dedicated to specific purposes over which the City has little program, policy, or expenditure discretion, and are supplemental to the core services the City provides. Most grant funding is federally funded, and grant funds vary year to year depending on the specific grants the City receives, their size, and the amount of funding carried over from previous years. Chicago’s overall grant funding increased sharply in 2020 due to COVID-19 pandemic relief programs and declined over the past few years as those programs are phased out.
Key Findings
- The Chicago budget’s increase of 40% over the period between 2019 and 2025 equates to an average annualized growth rate of 5.8%, compared to an average annualized inflation growth of 3.9% over the same timeframe.
- Pensions were the largest driver of the spending, increasing by $1.5 billion over six years. This increase is due in large part to rising obligations from a combination of state-mandated and supplemental payments needed to pay down the City’s massive unfunded pension liabilities. Increased pension costs alone drove 44% of the total increase in spending.
- Chicago Police Department (CPD) spending grew by $436.6 million, while the number of budgeted positions within the Department decreased by over 1,000. CPD still carries a high vacancy rate, which has the effect of driving up overtime costs.
- The Department of Aviation budget grew by $365 million due to the expansion of O’Hare International Airport.
- A handful of smaller departments saw their budgets more than double, including the Office of the Mayor, the Department of Planning and Development, the Department of Public Health, and the Department of Family and Support Services.
- Total personnel count has slightly declined by 371, or 1%, but the City still reported over 4,000 vacant positions in October of 2025.
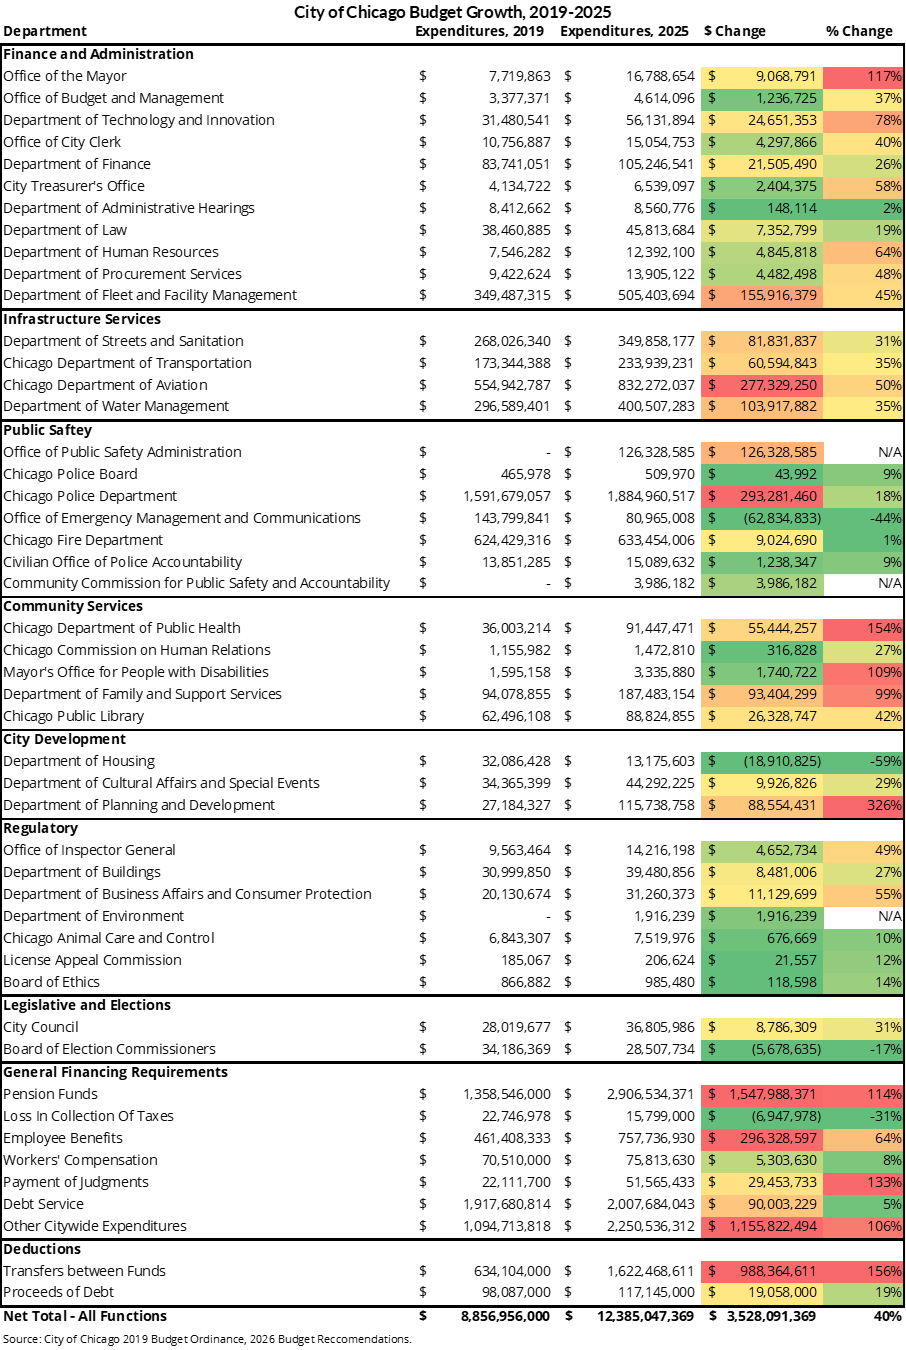
The following summary table shows the dollar and percent change in spending by department within Chicago’s budget across all non-grant funds between 2019 and 2025.
Spending Growth by Program Area
Between 2019 and 2025, the City budget grew by about $3.5 billion. The largest sources of growth are from increased pension costs, infrastructure services, and public safety spending.
Pensions & Debt
Chicago’s pension burden is a key contributor to the City’s overall budget growth. In 2019, the City spent $1.4 billion on its pension obligations. By 2025, the annual pension contribution had increased to $2.9 billion, an increase of $1.5 billion, or 114%, over six years. This growth is primarily attributable to the statutory contribution schedule defined by state law for funding Chicago’s unfunded pension liability. The supplemental pension payments that began under the Lightfoot administration and continued in the Johnson administration have also contributed to these increasing costs, as the City seeks to pay down more of its unfunded liability upfront to curb growth in pension costs over time. This policy has been successful—the supplemental payments have slowed growth in unfunded liabilities and reduced the City’s statutory payment obligations in future years. The proposed FY2026 budget reduces the supplemental pension payment by more than half, resulting in an overall decrease in pension expenditures from 2025 to 2026.
Debt service makes up a considerable part of Chicago’s budget, with the City paying just over $2 billion in 2025 in interest and principal payments on bonds. This represents 16.2% of the total budget. However, debt service has only increased by 5% since 2019.
Debt service and pension costs are often referred to as the “legacy burdens” of Chicago. In 2025, the combined cost of debt and pensions for the City was nearly $5 billion, accounting for approximately 40% of the entire budget. The combined increase in the City’s legacy burden costs from 2019 is over $1.6 billion, meaning that in 2025, the City paid 50% more than it did in 2019 for these costs. The increase is driven largely by growing pension contributions, while debt service has remained fairly level over the past six years. This trend is unlikely to change in the foreseeable future, as the City’s pension schedule sets a goal of 2055 or later for each of the major pension funds to reach 90% funding, and recent debt offerings by the City have included significantly backloaded principal payments. Additionally, new pension costs imposed by HB3657 have increased the unfunded liability of the police and fire pension funds, which will thus see their statutory contribution requirements rise in 2027.
Employee Benefits
The City’s expenditures on employee benefits, which include healthcare and other types of insurance, increased significantly between 2019 and 2025. In 2019, benefits spending totaled $461 million, but by 2025 it had grown to $758 million, an increase of $296 million, or 64%. As the number of employees did not grow over that time, this cost increase was driven primarily by more expensive healthcare benefits for City employees, often negotiated through collective bargaining agreements.
Finance and Administration
The City’s overall finance and administration costs increased from $555 million to $790 million between 2019 and 2025, a 43% rise. The largest dollar increase is within the Department of Fleet and Facility Management (2FM)—$155 million, or 45%. The Better Government Association notes that 2FM has seen significant growth in overtime costs in recent years. The working group convened by the Mayor to find options for closing Chicago’s budget hole identified significant efficiencies that could reduce expenditures for the fleet services portion of 2FM’s responsibility.
Several smaller departments within the finance and administration umbrella also saw large increases in their expenditures between 2019 and 2025. For example, the City’s Department of Human Resources saw a growth rate of 64%. The Department of Technology and Innovation grew by 78%. Perhaps most interesting, despite its small size, the Office of the Mayor grew by 117%, from $7.7 million in 2019 to $16.8 million in 2025.
Infrastructure Services
Overall infrastructure expenditures increased by $524 million between 2019 and 2025, representing a 41% rise. It is worth noting, however, that $277 million—over half of the total increase—is in Chicago’s Department of Aviation. This Department is self-funded, generating revenues from O’Hare and Midway Airports through landing fees and rental payments. Because the airport funds are Special Enterprise Funds dedicated to airport operations, changes in the Department of Aviation budget have a minimal impact on the rest of the City's budget.
Of the remaining $247 million in infrastructure service growth, $103 million is attributable to the Department of Water Management, a 35% increase. The City also saw a 31% increase of $82 million in the Department of Streets and Sanitation and a 35%, or $61 million, increase in the Department of Transportation.
Public Safety
Public safety is the largest program area of spending within the Chicago budget, totaling $2.7 billion in 2025. Public Safety spending grew by $371 million, or 16%, between 2019 and 2025. As the largest public safety department, the Chicago Police Department’s budget has grown by 18%, or $293 million, from $1.6 billion to $1.9 billion since 2019. CPD has seen its overall full-time equivalent (FTE) employee count decrease by over 1,000 since 2019. However, as FTEs declined, the Department has seen an increased number of budgeted vacancies and, as a result, increased overtime expenditures.
The Chicago Fire Department saw its expenses rise by only $9 million, or 1% between 2019 and 2025. However, the recently ratified collective bargaining agreement, which was delayed for years, is expected to add approximately $124 million in 2026, representing a 20% increase over 2025 spending levels. The City will also have to cover $380 million in back pay and other retroactive costs due to the multi-year delay in negotiating the agreement.
The Office of Emergency Management and Communications (OEMC) budget has decreased by $62 million, or 44%, over this six-year period. This is partially due to shifting crossing guards to the Chicago Public Schools budget in 2021, leading to a decrease in personnel of almost 50%. While OEMC declined, the Office of Public Safety Administration (OPSA) budget has increased. OPSA was created in 2020 with the goal of consolidating administrative functions, including IT, human resources, and financial management of the City’s public safety apparatus. In 2025, the OPSA had a budget of $126 million, compared to $31 million when it was established in 2020.
Community Services
Community services spending nearly doubled between 2019 and 2025, jumping by $177 million, or 91%. About half of this funding comes from a 99% increase of $93 million to the City’s Department of Family and Support Services, despite an approximately constant personnel count at DFSS. This is because the majority of DFSS’s budget is allocated to outside agencies, including nonprofits and private service providers. As the Department’s budget grew during the pandemic, internal operations and headcount remained fixed, but spending on delegate agencies and professional services grew.
The other major contributor to growth in the City’s community services budget is the Department of Public Health (DPH). The Department’s budget increased by 154%, or $55 million, between 2019 and 2025, due to rapid expansion as part of the City’s response to the COVID-19 pandemic. Although City funding for DPH has grown steadily since the pandemic, it is worth noting that DPH is primarily funded by federal grants. That grant revenue peaked in 2022, and the Department’s budget—inclusive of grants—has been slowly declining since.
City Development
Although it makes up a smaller portion of the overall City budget, City Development was up 85% between 2019 and 2025, a total $80 million increase. This is primarily due to a $88 million, or 326%, increase in the City’s Department of Planning and Development (DPD) budget, which grew from $27 million in 2019 to $116 million in 2025. This threefold growth was not due to an increase in staffing or operations, but rather the addition of a grant-making program, the Rehabilitation Loan Program, which provides funding to residents and business owners looking to rehabilitate vacant or run-down buildings. The grant program totals approximately $90 million in DPD’s 2025 budget, slightly higher than the Department’s overall growth since 2019.
The Department of Housing experienced a significant decrease in funding, from $32 million in 2019 to $13 million in 2025, representing a 59% reduction. However, the Department receives most of its revenue from federal grant funding, with $235 million in grants budgeted in 2025, so the reduction to its budget is not as massive as it appears when excluding grants.
How Chicago’s Spending Compares to Benchmarks
Total budget growth of 40% over the course of six years means the City’s budget increased at an average annualized growth rate of 5.8%. This certainly seems like a fast rate of growth, but how does it compare to other cities and the rate of inflation?
The Lincoln Institute of Land Policy collects and standardizes data on the budgets of the 150 largest cities in the United States of America. Over the course of 19 years, between 2000 and 2019, the average city in this database saw its budget grow by approximately 70%. This yields an average annualized growth rate of just 2.84%. That’s exactly half of Chicago’s recent growth rate. This data indicates Chicago is significantly outpacing the budget growth of its peers.
One argument that might justify Chicago’s fast-growing budget is the recent increase in inflation. A 2.8% annual growth rate might have made sense in an era of lower inflation. However, with significantly higher inflation rates over the past five years, cities have had to increase their spending more rapidly due to inflation driving up costs. However, even factoring in inflation fails to explain Chicago’s growth, actually and comparatively. The Consumer Price Index (CPI), a common measure of inflation, increased by 26% between January 1, 2019, and January 1, 2025, according to the Bureau of Labor Statistics, which is an annualized growth rate of 3.93%. By comparison, the City of Chicago increased its expenditures each year by far greater than the rate of inflation on an annual basis.
Personnel Changes
Despite a massive increase in spending between 2019 and 2025, the City’s number of budgeted full-time equivalent (FTE) positions declined slightly during this time, from 36,577 positions to 36,206 in 2025 (these counts include vacancies). This marks an overall decrease of 371 FTEs, or 1.01%. While most departments grew slightly or stayed roughly constant in headcount, the total net decline in positions was driven by significant personnel cuts in a handful of large departments:
- The Chicago Police Department reduced its budgeted FTE count by 1,151, or 7.7%.
- The Office of Emergency Management and Communications reduced FTEs by 1,179, a decline of 55%. As previously mentioned, a large portion of this decline is due to the City shifting responsibility for crossing guards to Chicago Public Schools.
The following chart shows the eight departments that experienced the largest net changes in budgeted FTEs between 2019 and 2025.
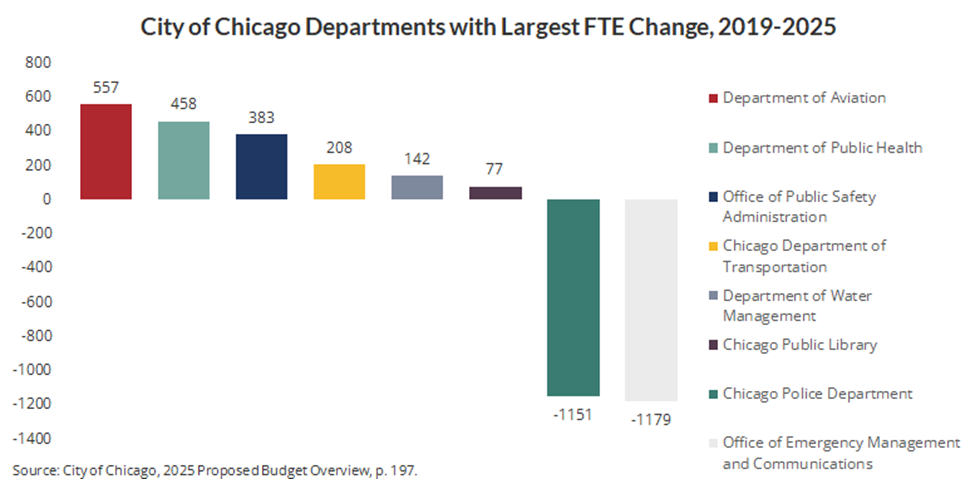
Several departments saw increases in budgeted personnel between 2019 and 2025. The department with the largest increase in personnel over this period is the Department of Aviation, which, as previously discussed, operates as an enterprise fund and is largely independent of the rest of the City budget. The Department saw an increase of 557 employees, or 30%. This increased hiring is due to the overall growth of the Department, as well as the ongoing expansion of O’Hare International Airport.
The Department of Public Health saw a substantial increase in personnel of 458 FTEs, or 78%, since 2019. DPH personnel grew from just under 600 positions in 2019 to over 1,000 in 2025. However, the 2026 budget proposal eliminates almost 300 budgeted positions from the 2025 budget. CDPH has one of the highest vacancy rates of any department in the City, with over 300 vacancies in 2025, so the move will bring the department’s budgeted personnel more in line with the number of filled positions.
The Office of Public Safety Administration has also seen significant growth during this time, as it was created in 2020, so the Office’s entire staff is new since 2019. OPSA has 383 budgeted positions in 2025, down from 411 when it was first formed in 2020.
Vacant Positions
As of October 2025, the City had just over 4,000 vacant positions throughout all departments, making for a total vacancy rate of 11.1%. The City’s proposed FY2026 hiring freeze, continued from 2025, has made it difficult for Chicago to fill many of these vacancies through hiring. The City’s high vacancy rate illustrates the need for a comprehensive organizational analysis to discover which vacant positions are necessary and which are not. The City should move to eliminate unnecessary vacant positions while filling needed positions by reallocating existing personnel or hiring new staff.
In 2025, CPD had 1,293 unfilled positions, a vacancy rate of 9.4%. A high vacancy rate can actually lead to increased costs for CPD, as fewer officers shoulder the same overall work burden, resulting in high overtime usage—a consistent problem for the Department.
Other departments with high vacancy rates in 2025 include:
- OEMC had 180 open positions, a vacancy rate of 18.3%.
- OPSA had 82 open positions, a vacancy rate of 22%.
- DPH had 33 open positions, a vacancy rate of 32%.
Conclusion
Chicago has seen a sizable increase of 40% in its budget between 2019 and 2025. Nearly half of the increase in spending went to covering pension and debt service payments—Chicago’s legacy burdens—the cost of which will only increase in future years. The remaining funding was spread throughout many of the City’s largest departments, with especially large growth in enterprise funds that support specific areas of infrastructure and therefore are not applicable to the rest of the City’s general operations.
This analysis finds that growth in spending has not been accompanied by a commensurate increase in personnel numbers, as one might expect if the City were intentionally expanding its footprint and service provision. The number of authorized FTE positions has decreased slightly by 1.01%, from 36,577 full-time employees in 2019 to 36,206 in 2025. Instead, large portions of spending have gone to non-discretionary items such as pensions and salary increases for existing employees, most of which are mandated by collective bargaining agreements.
As we see from the immense $1.2 billion budget deficit the City must close in 2026, these increasing spending levels raise questions about the sustainability of the City’s current spending structure, and how it will fulfill its commitment to cover the costs of legacy burdens while providing basic city services in the future.