December 01, 2016
The Civic Federation recently released its analysis of the CTA’s FY2017 Budget. The Civic Federation supports the Chicago Transit Authority’s FY2017 operating budget of $1.52 billion because it holds base fares flat and continues to make strategic capital investments despite ongoing state funding uncertainty.
As part the Civic Federation’s annual analysis of the CTA budget, the Federation uses two measures to assess CTA’s productivity over time: labor cost per actual unlinked passenger trip and operating expense per passenger mile.[1] The data used to calculate the productivity measures is obtained from the annual budget documents. In order for the CTA to be eligible for grant funding from the Federal Transit Administration, the Transit Authority must self-report certain data to the National Transit Database program, including operating expense per passenger mile.[2]
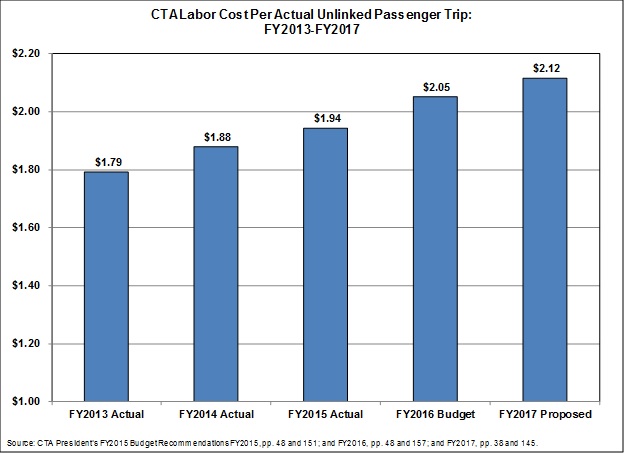
Productivity can be measured in terms of labor cost per unlinked passenger trip. A lower dollar amount indicates higher productivity. The labor cost per unlinked passenger trip indicator increased steadily from $1.79 in FY2013 to $2.12 in FY2017.
Between FY2013 and FY2017, productivity has declined because ridership, which fell by 1.9% on average each year, has not kept pace with labor costs. Those costs grew by 2.6% on average each year. As a result, the ratio has steadily increased over the five-year period, rising from $1.79 in FY2013 to $2.12 projected in FY2017. The decrease in ridership was reportedly the result of track construction and increased rates in fare passes in FY2013, extreme winter weather in FY2014 and FY2015 and increased competition from alternative transit operations such as Uber and Divvy and low fuel prices in FY2016 and FY2017.[3] The labor cost per unlinked passenger trip is expected to increase between FY2016 and FY2017 by $0.07 from $2.05 to $2.12. This will be due to a 2.5% increase in labor costs compared to a 0.7% decrease in ridership over the previous year.
Another indicator that provides information about the productivity of the CTA’s operations is operating expense per passenger mile for bus and rail service.[4] The latest data available for this indicator is provided for 2014 by the Federal Transit Administration’s National Transit Database Program.
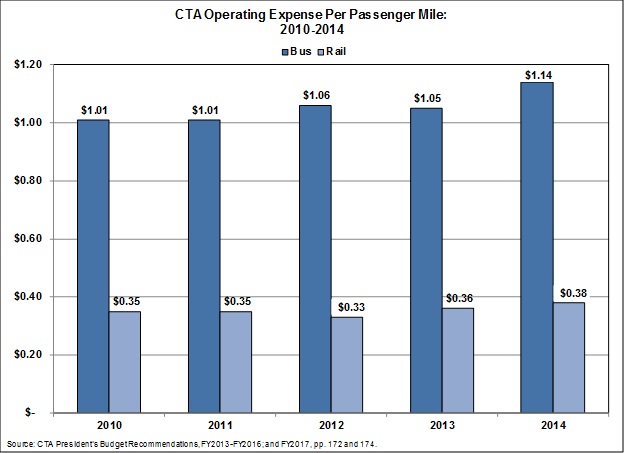
The chart below illustrates operating expense per passenger mile for bus and rail service between 2010 and 2014, the most recent years for which data is available. As with all transit systems, rail service is more cost effective than bus service because there is higher ridership on rail service. The operating expense per passenger mile for rail service has fluctuated only slightly over the past five years, declining from $0.35 in 2010 to $0.33 in 2012 before increasing to its highest point in 2014 at $0.38 per passenger mile.
The operating expense per passenger mile for bus service has increased by $0.13 over the last five years. It increased from a low of $1.01 in 2010 and 2011 to $1.14 per passenger mile in 2014.
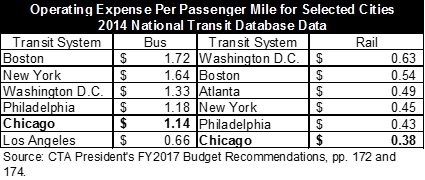
The last chart compares CTA’s operating expense per passenger mile for bus and rail service with selected cities. These transit systems were selected by the CTA to be comparable for its budget reports based upon the size of the urban area served, the urban characteristics of the service area, and the size of the transit system.[5] For bus transit, the CTA’s 2014 operating expense per passenger mile for bus service was the second lowest for cities examined. For rail transit, the CTA’s 2014 operating expense per passenger mile was the lowest when compared with the mass transit systems in other major cities.
[1] “Ridership” and “unlinked passenger trips” refer to total number of rides. Each passenger is counted each time that passenger boards a vehicle (bus or rail). CTA President’s FY2016 Budget Recommendations, p. 206.
[2] National Transit Database, https://www.transit.dot.gov/ntd (last accessed December 1, 2016).
[3] CTA President’s FY2017 Executive Budget Recommendations, p. 7.
[4] Operating expenses are costs associated with the day-to-day operations of the delivery of service for a transit agency and typically includes labor, material, fuel, power, security and professional services. CTA President’s FY2017 Executive Budget Recommendations, p. 198.
[5] CTA President’s FY2017 Budget Recommendations, p. 169.