November 04, 2009
While the Civic Federation traditionally analyzes features common to all local government budgets, our analyses of the Chicago Transit Authority’s (CTA) budgets include additional productivity measurement data. The Civic Federation uses expenditure, personnel and ridership data provided by CTA to gain insight into changes in productivity.
The Civic Federation uses three measures to assess CTA’s productivity over time: labor cost per actual unlinked passenger trip; actual unlinked passenger trips per budgeted position; and operating expense per passenger mile. For the purposes of this analysis, the Civic Federation used data provided by the Chicago Transit Authority for unlinked passenger trips. Unlinked passenger trips are a single journey by one passenger on a transit vehicle.
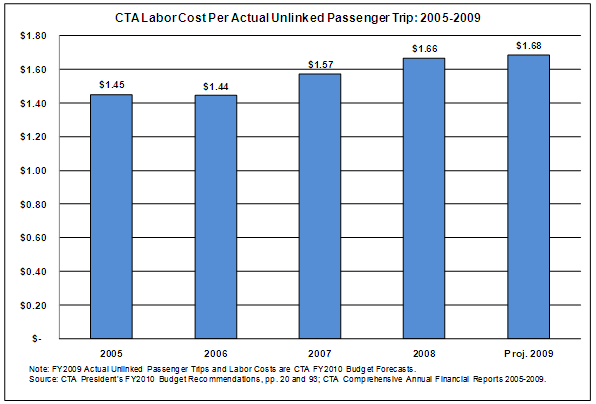
Productivity can be measured in terms of labor cost per unlinked passenger trip. A lower dollar amount indicates higher productivity. In the last five years this dollar amount has risen from $1.45 in 2005 to $1.68 in 2009, a 16.0% increase.
A second measure of productivity is unlinked passenger trips per employee. In this case, a higher number of trips indicates higher productivity. This trend shows that the number of trips per budgeted position has been increasing, rising from 45,287 trips per employee in 2005 to a projected 54,581 trips per employee in 2009, a 20.0% increase. Ridership per employee rose substantially between 2008 and 2009 as employee headcount was reduced.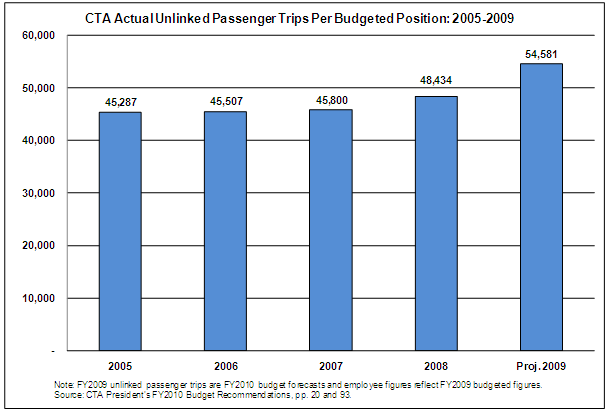
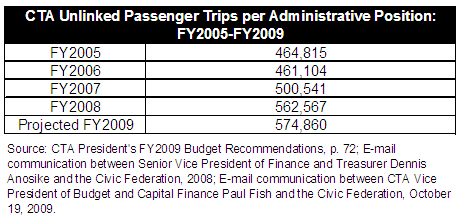
The table below shows unlinked passenger trips per administrative position. This trend generally resembles the trend for total positions above. The large productivity gains in 2007 and 2008 reflect cuts in administrative positions.
There are two other historic indicators that provide information about the productivity of CTA’s operations. The latest data available for these indicators is provided for 2007 by the Federal Transit Administration’s National Transit Database Program.
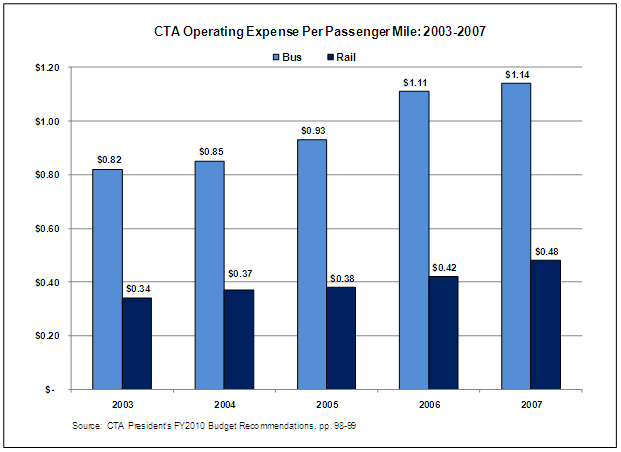
The chart below illustrates operating expense per passenger mile for bus and rail service between 2003 and 2007. As with all transit systems, rail service is more cost effective than bus service. The operating expense per passenger mile for rail service increased from $0.34 to $0.48 between 2003 and 2007, a change of 41.2%. For buses, operating expense per passenger mile increased from $0.82 to $1.14, a change of 39.0%, between 2003 and 2007.
For rail transit, CTA’s 2007 operating expense per passenger mile is comparable with the mass transit systems in other major cities. Chicago’s operating expense per passenger mile for bus service was the fourth highest for cities examined. Chicago’s operating expense per passenger mile for rail service was the second highest among the cities examined.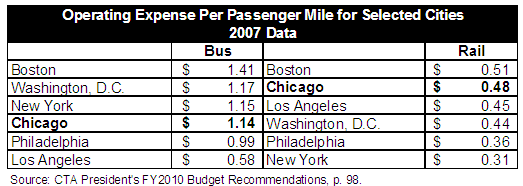
The productivity measures for CTA show mixed results. While CTA has been able to make gains in productivity in unlinked trips per budgeted position and unlinked trips per administrative position, its productivity has declined in terms of labor cost per actual unlinked passenger trip and operating expense per passenger mile. The gains in productivity reflect CTA’s steady increase in ridership and decrease in personnel over the five year period between 2005 and 2009.