February 12, 2015
The Civic Federation’s previous blog examined the long-term debt of eight major local governments in northeastern Illinois.
This blog explores the unfunded pension liabilities of ten pension funds sponsored by local governments in the Chicago area using a per capita indicator based on unfunded pension liabilities.
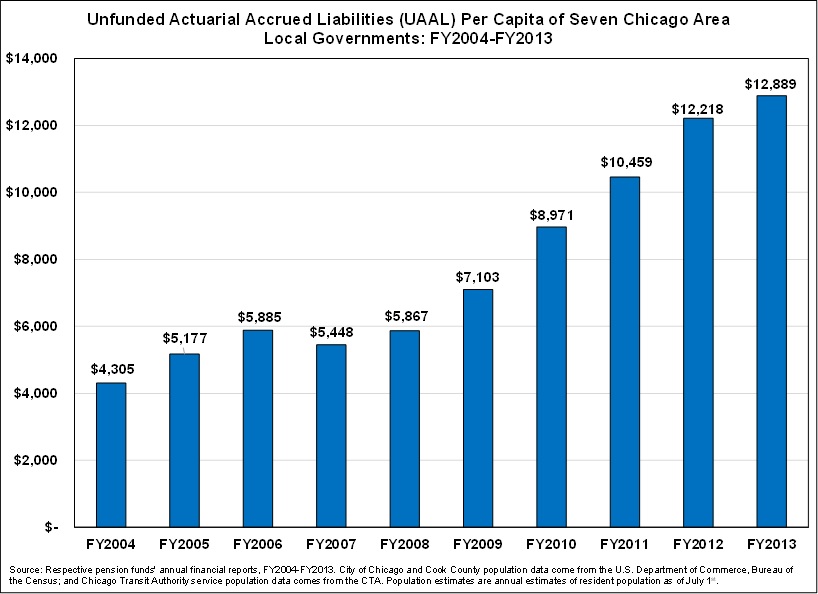
Between FY2004 and FY2013, pension obligations per capita for Chicagoans’ increased by 199.4%, rising from $4,305 to $12,889.
For Chicago residents, the pension obligations per capita indicator is helpful in understanding the affordability of current retirement benefits. Ultimately, an examination of all long-term obligations is important to determine whether debt burden is sustainable or whether the full costs of providing government services are being deferred – an issue of intergenerational equity. When governments balance annual revenues and expenditures without hoarding excess cash or borrowing from the future, they achieve intergenerational equity among taxpayers and others who pay for and receive government services now and in the future.
Methodology
It is important to recognize that pension liabilities are a product of actuarial calculations and market fluctuations. Also, governments frequently modify their pension contribution levels. Although Article XIII, Section 5 of the Illinois Constitution provides that membership in any pension system in the State is an enforceable contractual relationship and that member benefits “shall not be diminished or impaired,” it does not require that governments provide a specific level of funding to the pension systems.
The unfunded actuarial accrued liabilities (UAAL) is the amount by which a pension fund’s actuarial accrued liability (AAL) exceeds its assets, where the AAL is an estimate of the value of benefits already earned. It is important to note that some of the government’s calculations do not include other post-employment benefits (retiree healthcare) and no state and federal pension obligations are included in this calculation. The pension obligations per capita indicator trends are presented for local governments in the Chicago area from FY2004 to FY2013, the ten most recent years for which audited financial data are available.
The City’s portion of overlapping pension obligations include the following major Cook County governments with boundaries coterminous with the City of Chicago or located partially within its boundaries: the Chicago Public Schools, Cook County, the Forest Preserve District of Cook County, the Metropolitan Water Reclamation District and the Chicago Park District. To calculate the pension obligations per capita indicator, the Civic Federation includes the City’s portion of unfunded pension liabilities for all these governments, plus the CTA.
For more detailed information and evaluation of pension figures and trends for each local government, review the pension sections of our annual local budget analyses as well as blog posts on debt, pensions and other liabilities.
Findings
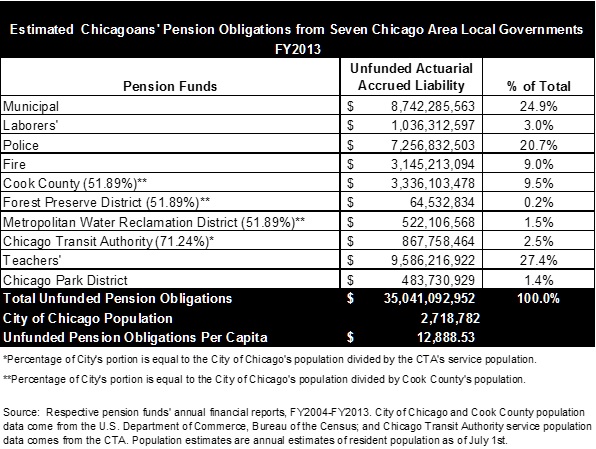
The exhibit below provides a breakdown of the pension obligations per capita calculation for fiscal year 2013. Unfunded pension obligations for the City’s four funds and the City’s portion of the pension funds of overlapping governments total $35.0 billion. The largest components of the indicator are the Chicago Teachers’ Pension Fund at $9.6 billion, or 27.4% of Chicagoans’ unfunded pension obligations, followed by the Municipal Pension Fund at $8.7 billion or 24.9%.
Between FY2004 and FY2013, pension obligations per capita increased by 199.4%, rising from $4,305 to $12,889. A breakdown of the per capita indicator reveals that the four City of Chicago pension funds (Municipal, Laborers’, Police and Fire) unfunded obligations per capita grew from $2,528 to $7,423, a 193.6% increase over the ten-year period.
The difference between total and per capita trends over the ten-year period can be attributed to changes in the population. From FY2004 to FY2013, the City’s population declined by 130,214 and the County’s population declined by 61,721. The following chart displays Chicagoans’ unfunded pension obligations per capita for the 10 local pension funds over the past 10 years.