July 29, 2022
This blog post examines the Chicago Public Schools’ contributions to the Chicago Teachers’ Pension Fund in the FY2023 budget and the funding status of the Pension Fund based on financial health indicators. Additional descriptive information about teachers’ pension benefits and history can be found in past budget analyses.[1]
Members of the Chicago Teachers’ Pension Fund
Certified CPS teachers are enrolled in the Public School Teachers’ Pension and Retirement Fund of Chicago (known as the Chicago Teachers’ Pension Fund or CTPF). Members of the Chicago Teachers Pension Fund do not participate in the Social Security program, so they are not eligible for Social Security benefits related to their CPS employment when they retire.
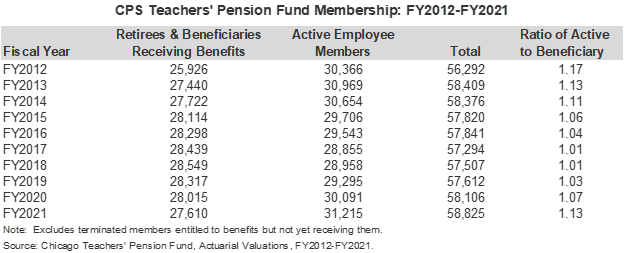
In FY2021, there were 31,215 active teachers participating in the pension fund and 27,610 beneficiaries. The following table shows the changes in CTPF membership over time and the ratio of actives to beneficiaries.
Recent Changes to Pension Funding Sources
The Chicago Teachers’ Pension Fund is severely underfunded. A combination of pension holidays, statutory underfunding, benefit enhancements, optimistic assumptions and other long-term problems have all contributed to its condition. The CTPF was put on a 50-year funding plan in 1995 which requires employer contributions from CPS when the fund falls below a 90% funded ratio. Relatively small additional amounts were required from the State and from CPS pursuant to benefit enhancements enacted in P.A. 90-0582. Effectively, this meant that CPS did not make more than a minimal employer contribution between 1995 and 2004, when the funded ratio fell to 86% and CPS resumed payments in 2006.[2] The funding schedule was altered in April 2010 by Public Act 96-0889, which reduced the CPS required pension contribution for FY2011, FY2012 and FY2013 to an amount estimated to be equivalent to the employer’s normal cost as a response to a budget crisis at the District.[3] The law also delayed the year the pension fund must be 90% funded from 2045 to 2059.
The State of Illinois had traditionally contributed $65 million per year to the Teachers’ Fund pursuant to State statute, which declares the General Assembly’s “goal and intention” to contribute an amount equivalent to 20%-30% of the contribution it makes to the downstate Teachers’ Retirement System.[4] However, $65 million provided nowhere near the 20-30% goal. The State is also required to make small additional contributions to offset a portion of the cost of benefit increases enacted under Public Act 90-0582.
In 2016 a State law passed as part of the State’s stopgap budget allowed CPS to levy a property tax dedicated to the Chicago Teachers’ Pension Fund, without the levy being subject to the Property Tax Extension Limitation Law (PTELL). The District previously had a dedicated pension levy until 1990, when it was transferred to fund general operating expenses and salary increases.[5] The 2016 law, Public Act 99-0521, allowed CPS to levy a property tax dedicated to the Chicago Teachers’ Pension Fund at a tax rate of 0.383%. The original 0.383% rate was expected to generate approximately $250 million a year starting in FY2017, partially offsetting the CPS contribution from funds that would otherwise go to classrooms and other general operations. A year later, the rate was increased to 0.567%. The pension levy is projected to generate $551.6 million in FY2023.
Illinois State legislation to change how P-12 education is funded through an Evidence-Based Funding formula, Public Act 100-0465, which was signed into law on August 31, 2017, included provisions to increase the State’s funding to Chicago teachers’ pensions starting in FY2018 to an amount equal to the annual cost of the pension plan’s benefits —the normal cost—and $65 million for retiree healthcare. The State normal cost and healthcare contribution offsets part of the statutorily required contribution. Public Act 100-0465 resulted in a significant increase in State funding to the CTPF, increasing funding from the State by $221 million during FY2018, which has decreased the amount of operating funds the District must direct to the pension fund.
Pension Contributions in the FY2023 Chicago Public Schools Budget
In FY2023, the total required employer contribution to the CTPF is $860.3 million, of which the State of Illinois will contribute $308.7 million, and CPS will contribute $551.7 million. The CPS portion is covered by the dedicated pension property tax levy. The following chart breaks down the sources of revenue for the employer contribution to CTPF.
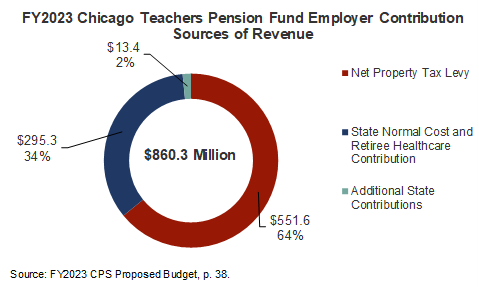
In addition to the contributions shown in the chart above, CPS contributes a portion of teachers’ own contributions to the pension fund, known as the pension “pick up.” That expense is projected to total $129.8 million in FY2023 and is discussed further below.[6]
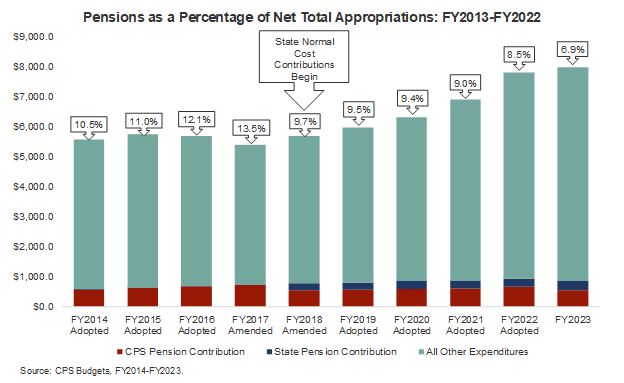
As shown in the following chart, the year before the State started making normal cost pension payments, pensions made up $733.2 million or 13.5% of CPS’s operating spending in FY2017. However, the following year that decreased to $551.4 million or 9.7% with the passage of the P-12 Evidence-Based Funding law. The percentage of the operating budget dedicated to pensions declined slowly over the next several years and in FY2023, CPS’s pension contribution declined to 6.9% of the operating budget because of increases in the budget but also because the required contribution declined due to extraordinary investment returns in FY2021.
Actual Pension Contributions Compared to Actuarially Determined Contributions
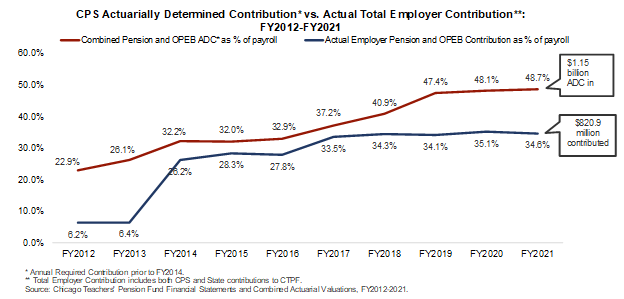
In order to analyze how far short of sufficient past years’ contributions have been, it is useful to compare the District’s actual contributions to an objective measure of how much it would need to contribute in order to pay off its unfunded liability over a set period of time. That measure, the Actuarially Determined Contribution (ADC), is a reporting requirement of the Governmental Accounting Standards Board and is reported in each pension fund’s annual actuarial reports.
The following chart compares the total actual employer contribution made by CPS and the State of Illinois to the CTPF as a percentage of payroll to the ADC as a percentage of payroll. The spread between the two amounts fell from a shortfall in FY2012 of 13.7 percentage points, or $371.4 million, during the District’s three-year pension funding holiday, to a gap of 3.7 percentage points in FY2018 due to CPS resuming pension funding, before growing again to a gap of 14.1 percentage points. In other words, to fund the pension plans at a level that would both cover normal cost and amortize the unfunded liability over 23 years, CPS and the State of Illinois would have needed to contribute an additional 14.1% of payroll, or nearly $334.0 million, in FY2021.
Employee Contributions
Employee contributions to the Teachers’ Pension Fund are statutorily set at 9.0% of the employee’s salary. One percent of that 9.0% amount is for survivors’ and children’s pension benefits.
Funded Status Indicators of the Chicago Teachers’ Pension Fund
In addition to evaluating whether an employer is contributing enough to the pension fund through a comparison to the ADC, it is important to understand how well-funded a pension plan is and whether funding is improving or declining over time. Pension fund status indicators show how well a pension fund is meeting its goal of accruing sufficient assets to cover its liabilities. Ideally, a pension fund should hold exactly enough assets to cover all of its actuarial accrued liabilities.
The Civic Federation analyzes three measures over time to evaluate funding status:
- Funded ratio;
- Unfunded actuarial accrued liabilities; and
- Investment rate of return.
Funded Ratio: The most basic indicator of pension fund status is its ratio of assets to liabilities, or “funded ratio.” In other words, this indicator shows how many pennies of assets a fund has per dollar of liabilities. For example, if a plan had $100 million in liabilities and $90 million in assets, it would have a 90% funded ratio and about 90 cents in assets per dollar of obligations to its employees and retirees.
When a pension fund has enough assets to cover all its accrued liabilities, it is considered 100% funded. This does not mean that further contributions are no longer required. Instead, it means that the plan is funded at the appropriate level at a certain date. A funding level under 100% means that a fund does not have sufficient assets on the date of valuation to cover its actuarial accrued liability.
Unfunded Liability: Unfunded actuarial accrued liabilities (UAAL) are obligations not covered by assets. Unfunded liability is calculated by subtracting the value of assets from the actuarial accrued liability of a fund. For example, if a plan had $90 million in assets and $100 million in liabilities, its unfunded liability would be $10 million.
One of the purposes of examining the unfunded liability is to measure a fund’s ability to bring assets in line with liabilities. Healthy funds are able to reduce their unfunded liabilities over time. On the other hand, substantial and sustained increases in unfunded liabilities are a cause for concern.
Investment Rate of Return: A pension fund invests the contributions of employers and employees in order to generate additional revenue over an extended period of time. Investment income provides the majority of revenue for an employee’s pension over the course of a typical career. In addition to the actual annual rate of return, the assumed investment rate of return plays an important role in the calculation of actuarial liabilities. It is used to discount the present value of projected future benefit payments and has been the subject of considerable debate in recent years.[7] The assumed rate of return for CTPF was reduced to 6.5% in FY2021 from 6.75% in FY2020.
Other major contributors to a pension fund’s financial status in addition to employer contributions and investment returns are benefit enhancements and changes to actuarial assumptions.
Funded Ratio
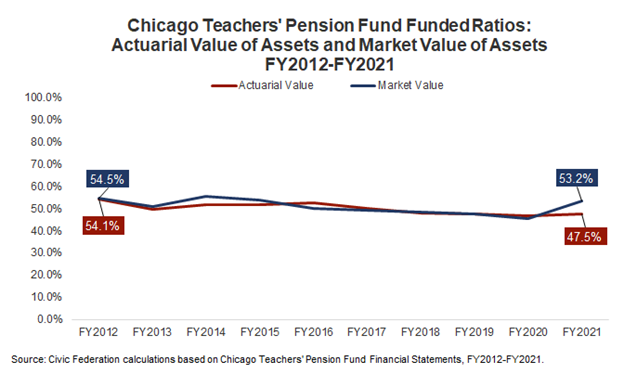
This section uses two measurements of pension plan funded ratio: the actuarial value of assets measurement and the market value of assets measurement. These ratios show the percentage of pension liabilities covered by assets. The lower the percentage, the more difficulty a government may have in meeting future obligations.
The actuarial value of assets measurement presents the ratio of assets to liabilities and accounts for assets by recognizing unexpected gains and losses smoothed out over a period of three to five years.[8] The market value of assets measurement presents the ratio of assets to liabilities by recognizing investments only at current market value. Market value funded ratios are more volatile than actuarial funded ratios due to the smoothing effect of actuarial value. However, market value funded ratios represent how much money is actually available at the time of measurement to cover actuarial accrued liabilities.
The following exhibit shows actuarial and market value funded ratios for the fund. Both the actuarial value funded ratio (47.5%) and market value funded ratio (53.2%) increased in FY2021. The larger increase in the market value funded ratio was due to high investment returns in FY2021 that will only be accounted for over four years in the actuarial value. The market value funded ratio has generally held flat over the last decade.
Unfunded Actuarial Accrued Liability
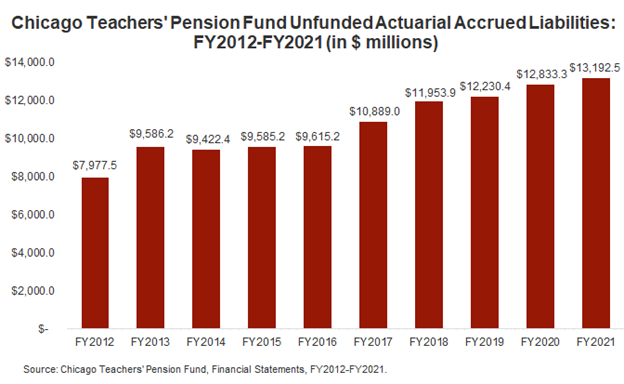
Over the past ten years, the unfunded liabilities of the pension fund have grown by $5.2 billion, or 65.4%. This was an increase from nearly $8.0 billion in FY2012. The total unfunded liabilities increased to $13.2 billion in FY2021 from $12.8 billion in FY2020, or by 2.8%. The unfunded liability increased in FY2021 despite record investment returns because of a change to the actuarial assumptions used by the fund, reducing the expected rate of return on investment to 6.5% from 6.75%.
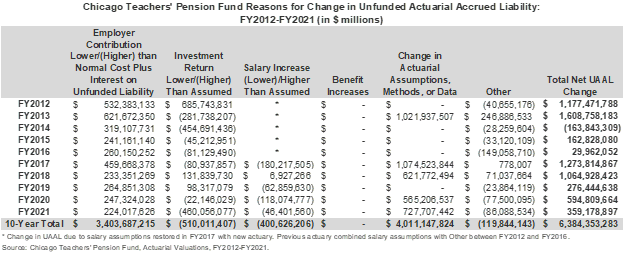
A breakdown of the causes of the change in unfunded liability each year is available in the annual actuarial valuations of the fund. The table below summarizes the changes as calculated by the fund actuary from FY2012 to FY2021. The single largest contributor to the increase in unfunded liability is the has been changes to actuarial assumptions at $4.0 billion, followed by the consistent failure of the employer contribution to be sufficient to cover the employer’s normal cost for service earned that year, as well as the interest accrued on the existing unfunded liability.[9] This deficiency in employer contributions added $3.4 billion to the unfunded liability between FY2011 and FY2021. Over the past 10 years, investment returns higher than assumed has reduced the unfunded liability by $510.0 million.
Investment Return
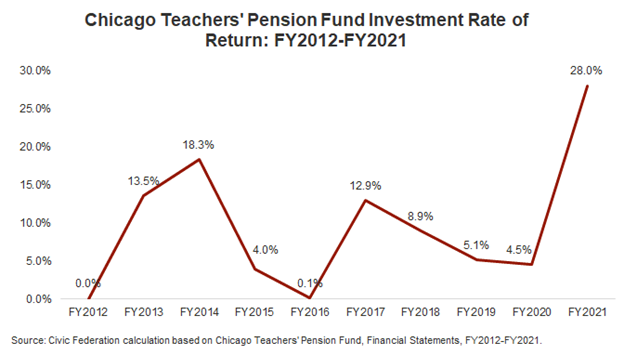
In FY2021 the CTPF experienced extraordinary investment returns far greater than its expected rates of return on investments, at 28.0%.[10] As noted above, the FY2021 investment assumption was 6.5%.
[1] See for example Civic Federation, “Chicago Public Schools FY2022 Proposed Budget: Analysis and Recommendations,” July 28, 2021, pp. 52-66. Available at https://www.civicfed.org/CPS_FY2022.
[2] CPS FY2023 Proposed Budget, p. 41.
[3] “Normal cost” is an actuarially-calculated amount representing that portion of the present value of pension plan benefits and administrative expenses which is allocated to a given valuation year.
[4] 40 ILCS 5/17-127
[5] See Civic Federation, “Chicago Public Schools Reinstates Teachers Pension Levy,” August 26, 2016. https://www.civicfed.org/civic-federation/blog/chicago-public-schools-reinstates-teachers-pension-levy
[6] CPS FY2023 Interactive Proposed Budget, Revenues and Expenditures, available at https://www.cps.edu/about/finance/budget/budget-2023/.
[7] For a short description of the debate see Thomas J. Healey, “Commentary: A note on the discount rate,” Pensions and Investments, October 8, 2019. Available at https://www.pionline.com/industry-voices/commentary-note-discount-rate.
[8] For more detail on the actuarial value of assets, see Civic Federation, Status of Local Pension Funding FY2012, October 2, 2014.
[9] Total increase in unfunded liability includes increase in FY2012 over FY2011, included in the first line of the chart below.
[10] The Civic Federation calculates investment rate of return using the following formula: Current Year Rate of Return = Current Year Gross Investment Income/ (0.5*(Previous Year Market Value of Assets + Current Year Market Value of Assets – Current Year Gross Investment Income)). This is not necessarily the formula used by the pension funds’ actuaries and investment managers; thus investment rates of return reported here may differ from those reported in a fund’s actuarial statements. However, it is a standard actuarial formula. Gross investment income includes income from securities lending activities, net of borrower rebates. It does not subtract out related investment and securities lending fees, which are treated as expenses.
