April 09, 2025
By Lily Padula
A comparative analysis of state expenditures finds that Illinois allocates a larger portion of its operational expenditures to pension obligations than most peer states. Illinois’ annual expenditures on state-level public pensions totaled nearly $12.2 billion, or approximately 11% of Illinois’ total operational expenditures, based on FY2023 national data. This substantial allocation surpasses that of nearly all 12 peer states used for comparison, as well as the national average. This underscores the severity of Illinois’ pension crisis and raises concerns about the state’s ability to adequately invest in other critical public services which suffer from a crowding out effect from the diversion of taxes to pensions and makes it challenging to discern Illinois’ broader fiscal priorities. Concurrently, Illinois residents bear one of the highest tax burdens in the nation at both the state and local level.
This analysis compares FY2023 operating spending on Illinois’ four largest spending categories at the state level—education, Medicaid, transportation, and pensions—to spending on the same categories as a percentage of total operating expenditures in 12 peer states. The 12 peer states include the five most populous states in the U.S.—California, Texas, Florida, New York, and Pennsylvania (Illinois is ranked 6th), and seven neighboring Midwest states—Indiana, Iowa, Michigan, Minnesota, Missouri, Ohio, and Wisconsin.
Using self-reported data from the National Association of State Budget Officers, along with data from KFF and the United States Census Bureau 2023 Annual Survey of Public Pensions, this report examines total state operating expenditures across all funds (excluding capital funds). By analyzing spending patterns, we hope to gain insight into how states allocate their resources and to understand how Illinois’ spending priorities align with or diverge from peer states.
Illinois ranks lowest among peer states in Elementary and Secondary (K-12) Education and Medicaid spending as a share of total operating expenditures. The State also ranks second to last in Higher Education spending and falls tenth in Transportation spending. In contrast, Illinois allocates the second-highest percentage of total operating expenditures to pensions among its peer states.
While the reasons behind variations in spending across peer states require further research, state spending may vary due to demographics, fiscal health, economic priorities, and policy decisions. These variations underscore how state budgets are shaped by their unique challenges and policy choices. Government structure likely also plays a role in terms of how much funding for program areas comes from the state vs. local government or other governmental entities.
Pension Spending
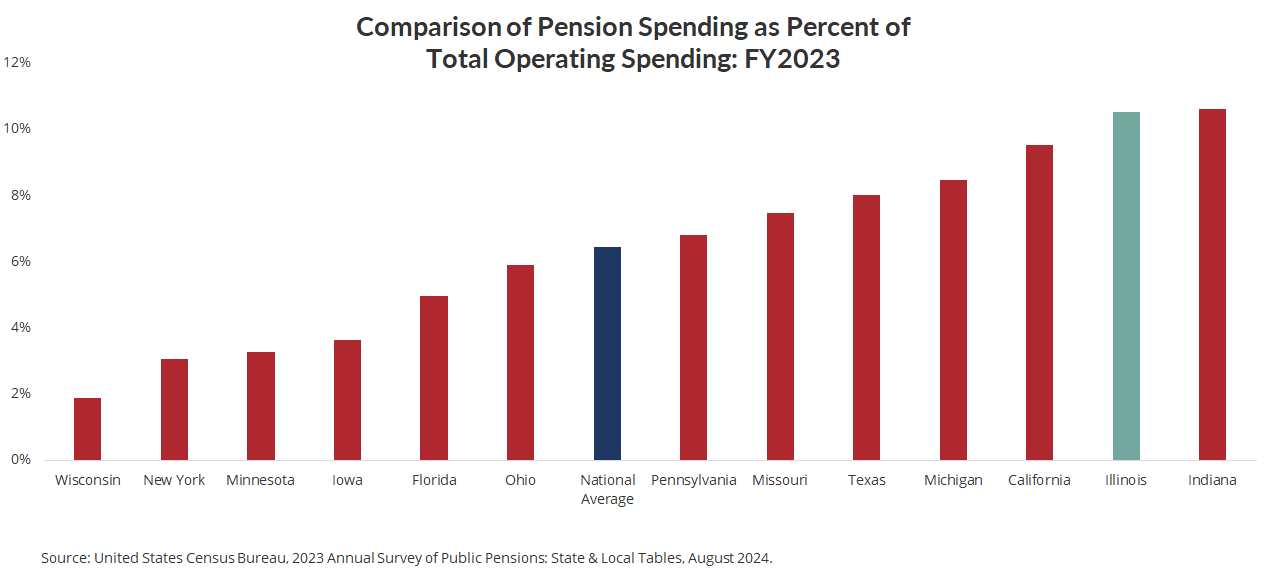
Pension expenditures account for 10.5% ($12.2 billion) of Illinois’ total all-funds operating budget, ranking second highest among peer states. This significant allocation reflects Illinois’ longstanding pension challenges, driven by decades of underfunding, rising retirement costs, and structural imbalances in the pension system. A substantial portion of the state’s financial resources is tied to paying down legacy obligations, limiting its flexibility to invest in other critical areas such as education, Medicaid, and social services.
The only state among the peer comparison group that spends more on pensions as a percentage of total budget is Indiana, at 10.6%. This is likely due to the fact that Indiana made additional appropriations to their Pension Stabilization Fund in three recent years including 2023. This may contribute to a temporarily higher percentage of Indiana’s total expenditures being allocated to pensions in FY2023.
Illinois’ pension system has faced persistent funding shortfalls, outlined in the Civic Federation’s FY2026 State Budget Roadmap, with unfunded liabilities exceeding $140 billion, making it one of the most underfunded pension systems in the country. The State's Tier 2 pension system, implemented for employees hired after 2011, was designed to reduce future liabilities, but concerns remain regarding its adequacy and compliance with federal Social Security Safe Harbor rules. Illinois has pursued pension buyout programs and re-amortization strategies to manage costs, but these measures alone are unlikely to resolve long-term structural issues.
Given the substantial financial burden pensions place on the State budget, sustainable reforms are needed to ensure fiscal stability while maintaining commitments to retirees. Strengthening the State's financial position will require a multi-pronged approach that includes disciplined long-term planning, potential revenue adjustments, and structural pension reforms, such as pension consolidation, to ensure both the sustainability of the retirement system and the state’s overall fiscal health.
Education Spending
Education spending consists of elementary and secondary (K-12) education, as well as higher education spending. This section compares Illinois’ spending to peer states in both categories.
Elementary and Secondary Education
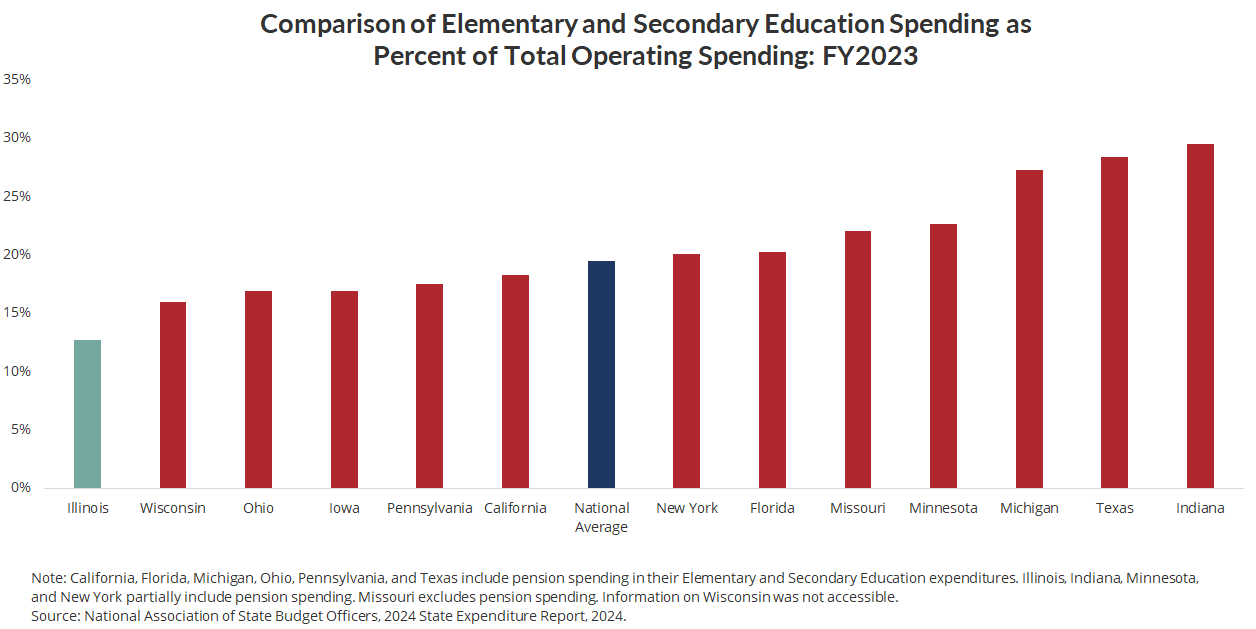
Elementary (K-Grade 5) and Secondary (Grades 6-12) Education accounts for 12.7% ($14.7 billion) of Illinois’ total expenditures, well below that of peer states and the national average. These differences in the percentage of total expenditures may be due to peer states’ education funding formulas. All of Illinois’ peer states except Wisconsin use a student-based foundation formula, which allocates a base amount of funding per student while applying additional weights for students with greater needs. Wisconsin utilizes a guaranteed tax base or tax-levy equalization model, which adjusts funding levels to provide greater state support to property-poor districts. Illinois operates under a hybrid model, the Evidence-Based Funding (EBF) formula. The EBF combines elements of student-based foundation and resource-based allocation, incorporating multiple cost factors to ensure a fairer distribution of education funding. The EBF model directs increased state funds to school districts that are furthest from their adequacy targets, which are defined as the funding levels necessary to provide a high-quality education based on specific cost factors. By utilizing the EBF model and integrating hybrid funding strategies, Illinois aims to create a more sustainable and equitable education funding system.
However, Illinois’ lower spending compared to peer states and the national average raises important questions about whether current state funding levels are sufficient to meet student needs. While the EBF formula represents progress toward a more equitable system, there remains a significant reliance on local government to fund K-12 education in Illinois, which results in lower state funding and higher local funding in the form of property taxes. This indicates the need for recalibration and refinement of funding mechanisms that support K-12 education in Illinois to ensure all students receive the resources required for a high-quality education.
Higher Education
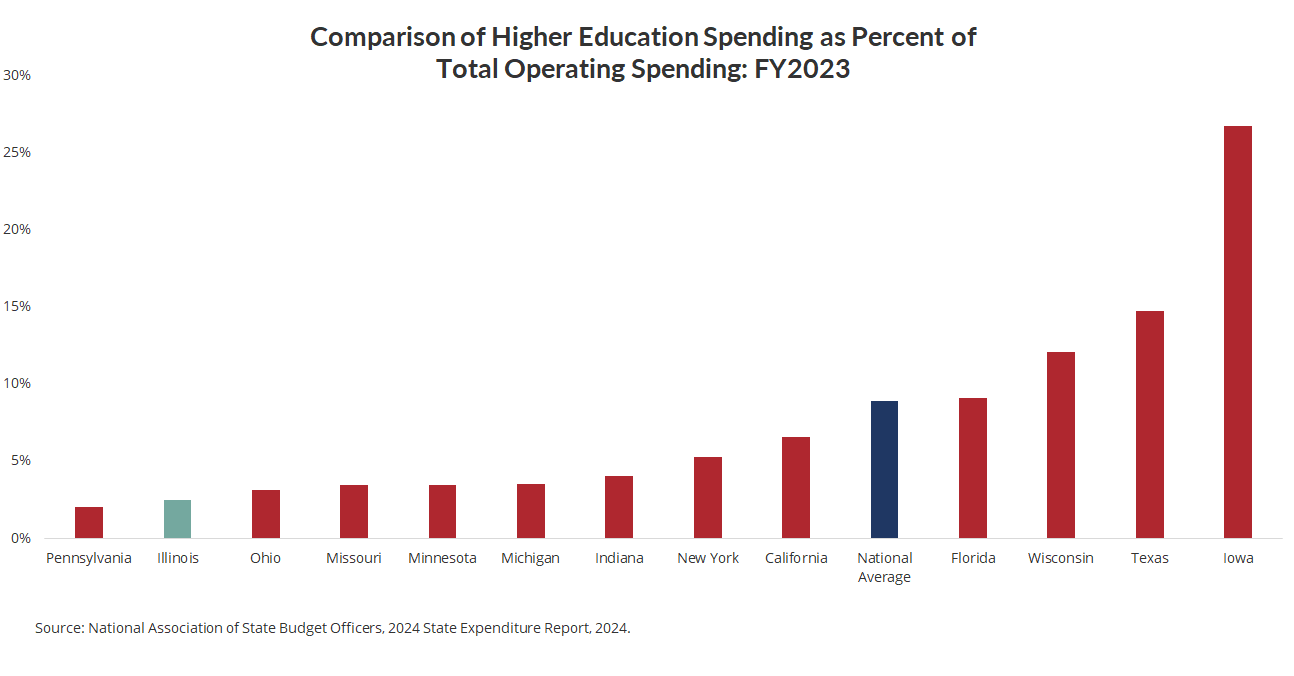
Nearly 3% ($2.9 billion) of Illinois’ expenditures are spent on Higher Education, the second lowest among peer states and lower than the national average. Higher Education includes public university systems, community colleges, career and technical education (CTE) institutions, and financial aid. Illinois spent $1.2 billion on public university systems, $361 million on community colleges, and $1.3 billion on CTE and financial aid combined.
Illinois' notably low investment in higher education raises the question of whether the State's funding approach adequately supports its colleges and universities or if additional reforms are needed to strengthen higher education accessibility and outcomes. A Commission on Equitable Public University Funding issued a report that recommended the adoption of an equity-based funding formula for higher education in Illinois, which has not been implemented to date.
Instead of using a funding formula, Illinois makes across-the-board increases or decreases in annual spending on public universities, which do not account for institutional needs or the changing demographics and requirements of students. In contrast, other states implement performance-based funding to allocate resources to higher education institutions. California, Florida, Indiana, Michigan, Ohio, Texas, and Wisconsin implement performance-based funding for all two-year institutions. Additionally, Florida, Iowa, Michigan, Ohio, and Texas apply performance-based funding to all universities. Among these states, only Florida, Michigan, Ohio, and Texas use performance-based funding for both two-year and four-year institutions. Currently, Illinois applies a minimal performance-based funding model for two-year institutions, but the funding amount is so small that it does not meaningfully impact higher education financing in the state.
Medicaid Spending
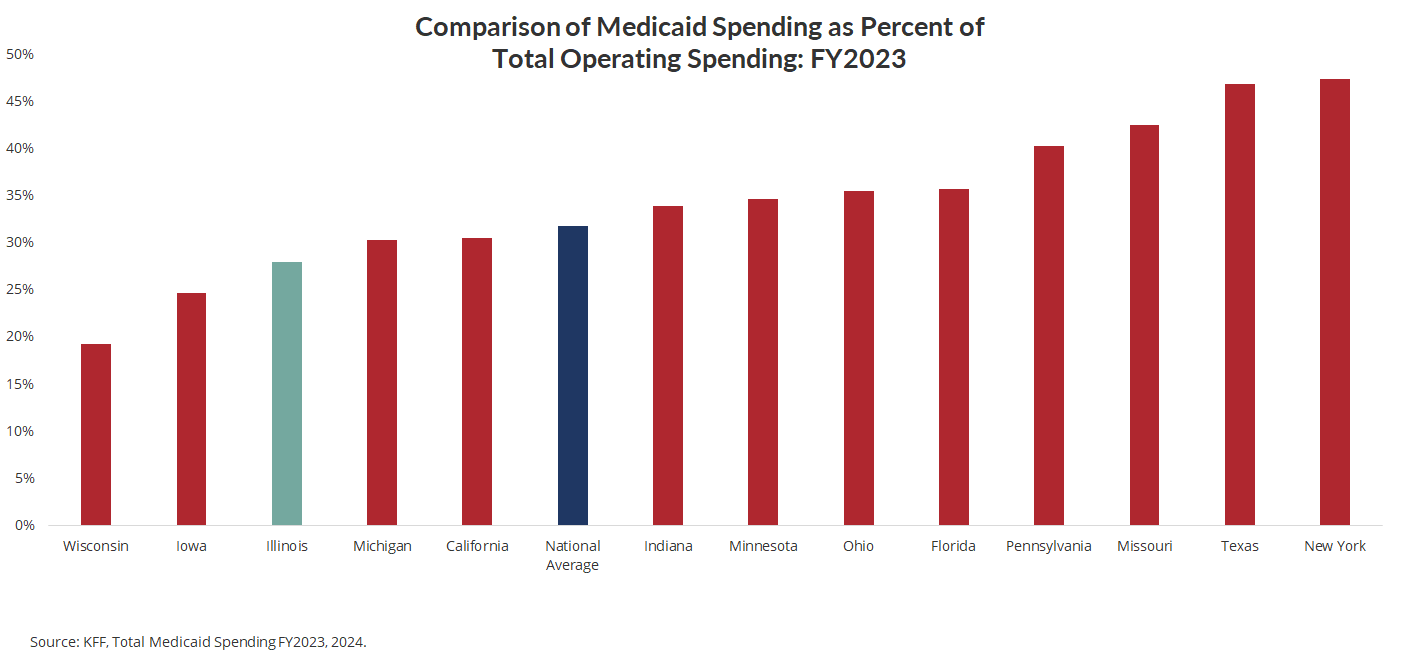
Medicaid, the joint federal and state program that helps cover medical costs for low-income individuals and families, accounts for 27.9% ($32.3 billion) of Illinois’ total expenditures, the third lowest percentage among peer states, indicating that Illinois allocates a comparatively smaller share of its budget to Medicaid. There are many factors that could impact Medicaid spending, such as enrollment levels and reimbursement rates. Understanding why Illinois’ Medicaid spending falls below that of other peer states is a question that requires further research.
Transportation Spending
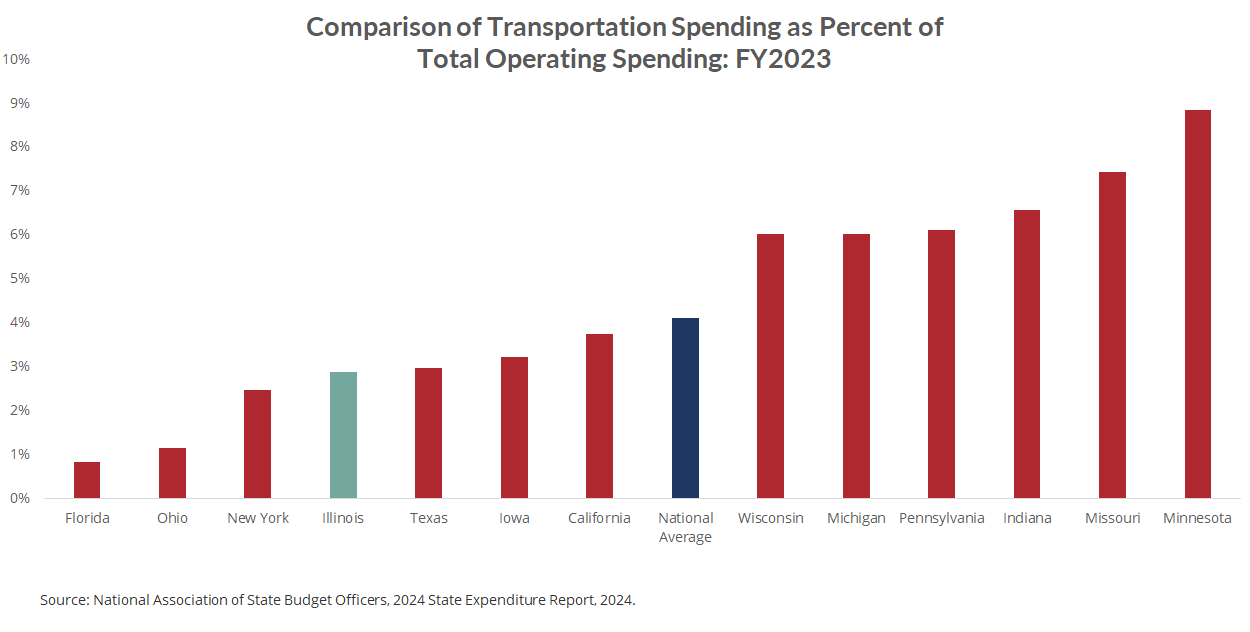
Transportation operating spending (excluding capital spending)—the operating expenditures for highways, mass transit, railroads, and airports—accounts for 2.9% ($3.3 billion) of Illinois’ total operating expenditures, ranking 10th among its peer states and lower than the national average. While this percentage places Illinois ahead of New York (2.5%) and Ohio (1.1%), it falls behind states like Missouri (7.4%) and Minnesota (8.9%), indicating that Illinois' investment in transportation operations is moderate compared to its peers.
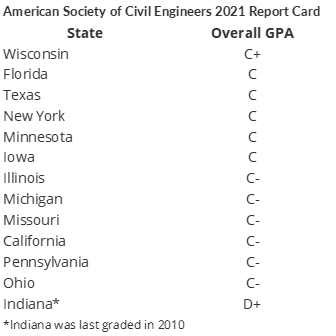
With the State’s central geographic location and role as a national transportation hub, Illinois' transportation funding supports a wide range of infrastructure needs, including public transit, major interstates, rail networks, bridges, and one of the busiest airports in the country (O’Hare International Airport). The State’s extensive road network and reliance on freight transportation make consistent investment in infrastructure critical to economic development and mobility. However, the American Society of Civil Engineers Infrastructure Report Card gives Illinois a C-minus on its infrastructure, stating that there is significant under-investment in transportation. Comparatively, Illinois is graded below peer states such as Wisconsin (C+) and Minnesota (C).
As aging infrastructure, congestion, and public transit funding challenges continue to put pressure on the system, Illinois may need to reassess whether its current level of transportation spending is sufficient to meet future demands. Increased funding could be necessary to support maintenance, modernization, and expansion projects that enhance economic competitiveness, improve safety, and promote environmental sustainability.
Conclusion
As noted above, Illinois’ resource allocation reflects its priorities, policy choices, and unique challenges. While no firm conclusions can be drawn by numbers alone, the State’s pension commitments consume a significant share of the budget, while spending in other critical areas lags behind peer states, raising concerns about long-term sustainability and service adequacy. As Illinois looks to the future, policymakers must explore potential reforms to ensure fiscal stability while meeting public service demands.