February 06, 2024
A report released by the Cook County Clerk in November 2023 found that revenue from tax increment financing (TIF) districts in Cook County increased for a sixth straight year to a record $1.7 billion, including approximately $1.3 billion from the City of Chicago and $404.3 million from suburban Cook County. The $1.7 billion total accounts for a 7.5% increase from tax year 2021 and represents 9.6% of billed property taxes in the County. Thirteen TIF districts were closed in tax year 2022, most of which were in the suburbs and had generated a collective $14.4 million in 2021. Twelve new TIF districts were created in tax year 2022 and generated approximately $7.5 million that year, mostly from the new Red Line Extension TIF. The table below provides a summary of property tax and TIF information for the City and suburban Cook County.
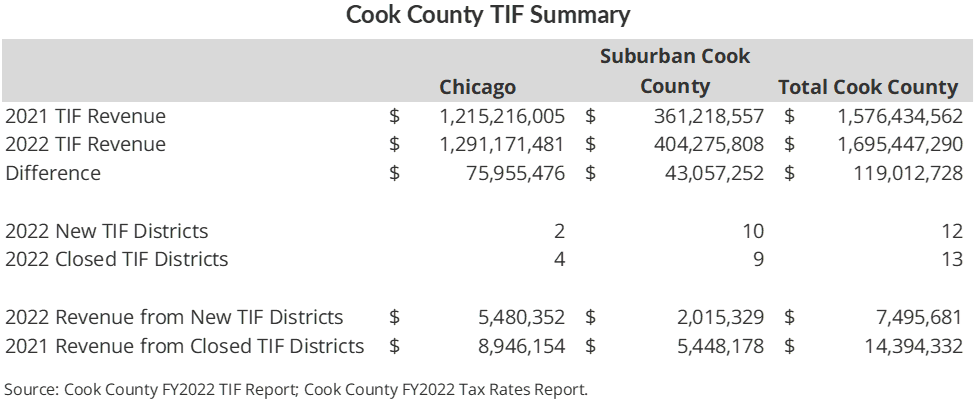
The Clerk’s Office’s annual TIF report provides information about revenues collected for each of the County’s 447 active TIF districts in the most recent collection year compared to the prior year. The County also provides interactive maps that allow users to search for TIF data by district, address and property identification numbers, and provides a means to download and export that data. Users can also create their own maps through drawing and text tools.
City of Chicago Updates
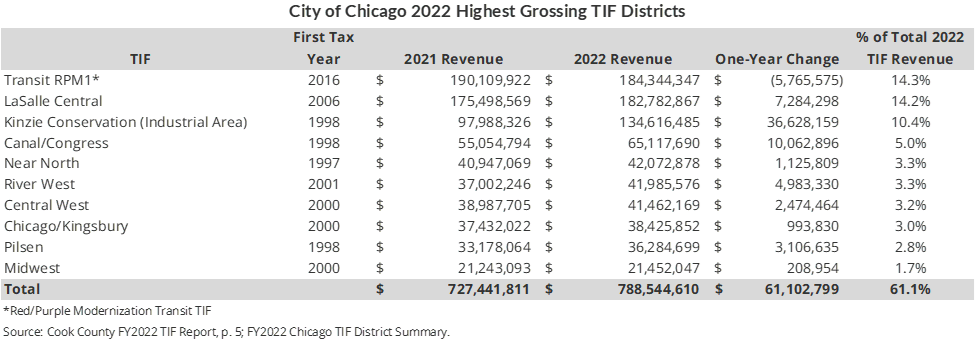
Revenues generated by the City of Chicago’s 127 active TIF districts increased from $1.22 billion in 2021 to $1.29 billion in 2022, an increase of 6.3%. The ten highest grossing districts in the City, as shown in the chart below, generated between $20 and $184 million in revenue for the year. However, the single most productive TIF, the Red-Purple Modernization (RPM) Transit TIF, experienced a nearly $5.8 million decline in revenue from 2021, which the Clerk’s Office attributes to a 2022 decrease in the County’s equalization factor, which is determined by the Illinois Department of Revenue.
The overall revenue increased despite the City closing four TIF districts in 2022. As the table below shows, these four TIF districts generated over $8.9 million in 2021 and $113.8 million over their lifetimes.
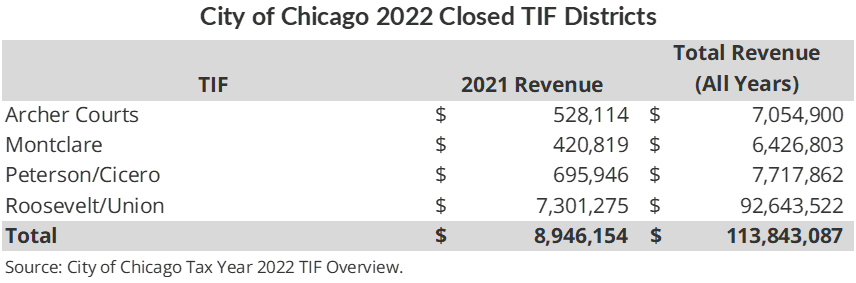
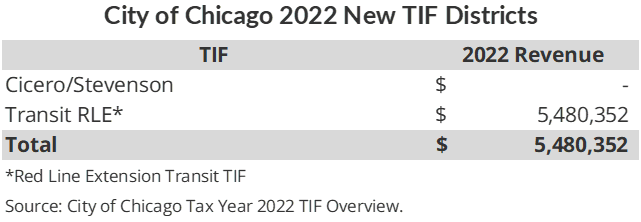
The City also created two new TIF districts in 2022, one of which was the City’s second transit TIF for the Red Line Expansion (RLE) project. The RLE transit TIF generated nearly $5.5 million in 2022 and was the only of the two districts to generate revenue in its first year.
In property tax TIF districts, the Equalized Assessment Value (EAV) of the district at the time of creation is measured and established as a baseline, which is often called the “frozen” EAV. Tax revenues generated from the incremental growth in EAV over the frozen amount are used to pay for redevelopment costs. Once the redevelopment project is completed and has been paid for or after 23 years have elapsed, the TIF district is dissolved. Following dissolution, the increment EAV is added to the tax base accessible to all eligible taxing districts. Crucially, the dissolved TIF increment value is treated as new property under the Property Tax Extension Limitation Law (PTELL) for the year it is added back into the tax base, which means overlapping governments can generate additional revenue by taxing the new property. Additionally, any unspent funds in a dissolved TIF district’s accounts are distributed to the overlapping governments based on their percentage of the tax bill.
Suburban Cook County Updates
Although TIF revenue from Chicago comprises 77% of total TIF revenue in Cook County, there are an additional 320 active TIFs in various suburban municipalities. TIF revenues in suburban Cook County saw an 11.9% increase over 2021. While the report attributes this increase to reassessment in the north and northwest suburbs, which saw TIF revenue increases of 12.3% over 2021, we note that the southern and western suburbs, saw an 11.6% increase in TIF revenue, which is significant for a non-reassessment year and despite a 1.6% reduction in taxable values. This is primarily due to large increases in two specific TIFs over the prior year due to large businesses moving into the two districts.
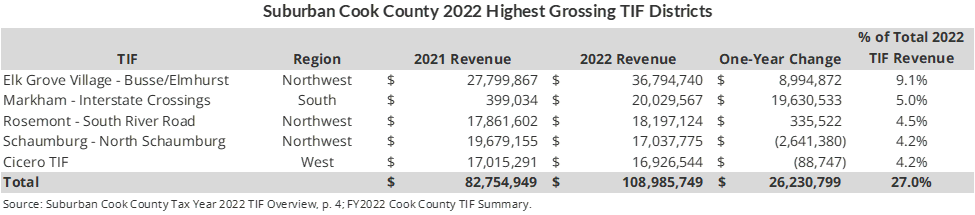
The table below shows the five highest grossing TIF districts in suburban Cook County, three of which saw revenue increases over FY2021. Collectively, these five districts account for 27% of all suburban TIF revenue and accounted for $26.2 million in revenue growth over 2021.
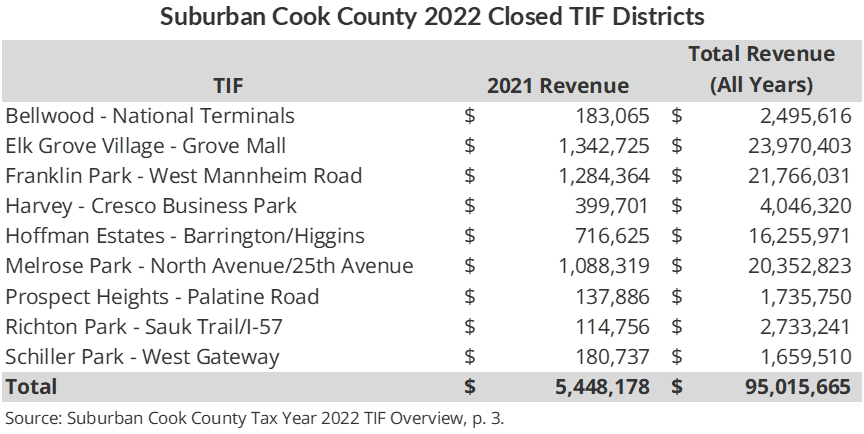
Nine suburban TIFs were closed in 2021, as illustrated in the table below. Cumulatively, these nine districts generated $5.4 million in revenue for FY2021 and $95 million over their collective lifetimes.
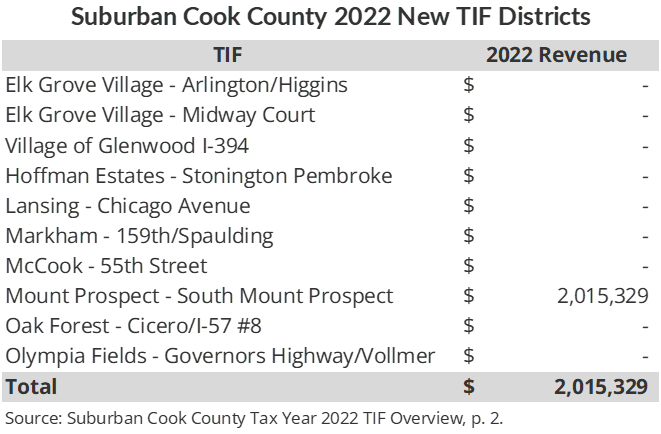
Additionally, ten new TIFs were created, only one of which began generating revenue in tax year 2022, as shown below. That district generated just over $2 million in its first year. One TIF district (Lynwood – Vernon Park Village) expanded by two parcels in 2022 but did not accrue revenue for the year.
Related Links
2022 Cook County TIF Report Executive Summary
2022 City of Chicago TIF Summary
2022 City of Chicago TIF Overview